Commercial Control for Telecom B2B

Structure every deal.
Protect every margin.

Complex B2B offers change on the way to the customer: discounts, subsidies, investments, special conditions. Each one moves the economics of the deal. Vincora combines full CPQ (configuration, pricing and quoting) with deal economics and commercial governance in one workflow, so Sales can move quickly while management stays in control.

Commercial clarity at every deal_
Offer Lifecycle Management Real-Time CM2 Analysis Multi-Level Approval Workflows NPV & ROI per Offer Investment Payback Tracking Sales Force Dashboard Portfolio Target Achievement Bulk Offer Management AI-Guided Offer Optimisation Offer Lifecycle Management Real-Time CM2 Analysis Multi-Level Approval Workflows NPV & ROI per Offer Investment Payback Tracking Sales Force Dashboard Portfolio Target Achievement Bulk Offer Management AI-Guided Offer Optimisation

Margin rarely disappears in one decision.
It erodes one concession at a time.

Every B2B deal starts with a commercial rationale. Then the negotiation begins.

A discount is added. A device is subsidised. A special price is approved. An investment is included. A contract condition changes.

Each decision can be reasonable on its own. Together, they change what the deal is worth. The question is no longer can we make this offer. It is is this still a good deal for us.

A discount rule tells you what Sales may give away.

Deal economics tells you what the business can afford to give away.

Vincora connects both.

A workflow engine answers what may be sold. An analytical engine answers what the deal is worth. Vincora runs both in the same process, which is why the economics are available while the offer is still being shaped.

A discount rule

Governs the input

Discount % Rule table Decision
100% off international traffic Blocked, escalated
5% off the service they use Auto-approved

The customer never enters the calculation.

Deal economics

Governs the outcome

Customer profiling Discount % Margin calculation Rule table Decision
100% off international traffic CM2iContribution Margin 2: revenue minus all direct costs of the deal. That means the traffic and infrastructure costs behind CM1, plus the direct costs the deal itself carries, such as device subsidies and additional equipment. Unlike a discount percentage, it means the same thing on every deal. unchanged → same approval level
5% off the service they use CM2 −2.4pp → same or higher approval level

The customer is the calculation.

A percentage has no fixed meaning: the same discount does not have the same economic impact on every customer or every deal. Vincora carries both measures through one workflow: the rule that governs what may be given, and the economics that show what can be afforded.

Structure → Economics → Decision

Configure the offer inside a controlled commercial process.

Vincora includes full CPQ (configuration, pricing and quoting) inside a commercial control workflow. Traditional CPQ answers an essential question: what can we sell, and at what price. Vincora carries a second one alongside it: what does this deal mean economically for us. One place where the offer is built, revised and recorded, from first draft through revisions, approval and customer decision.

Offer Lifecycle Management

Take every offer from draft through pending, review, and customer acceptance. Track versions, amendments, and renewals in a single timeline. Support your entire sales force of 10, 20, or 100+ reps from one view.

Draft Pending Approved Accepted

Profitability Analytics

Every offer is scored in real time for CM2%, NPV, ROI, and investment payback. Set thresholds per product family. Flag margin risk before it reaches approval. See weighted averages across your entire portfolio.

CM2% NPV ROI Payback

Approval Workflows

Configure multi-level approval chains by margin band, deal size, or product type. Automatic escalation when thresholds are breached. Full audit trail from first quote to final signature.

Multi-Level Auto-Escalation Audit Trail

Sales Force Dashboard

Pipeline overview, target achievement by rep and team, offer velocity metrics, and portfolio health, all in real time. Designed for sales directors who manage large teams across complex product portfolios.

Pipeline Targets Portfolio Velocity

Your deal goes in. Commercial clarity comes out.

Every time the offer changes, Vincora scores it: calculating margins, forecasting P&L and routing the offer to the right approval level, while there is still time to change the deal.

What feeds the engine
Products & Services
Full catalog with cost layers
Customer Behaviour
Actual history or matched behavioural cohort
Discounts
Applied commercial conditions
Pricing Rules
Guardrails, floors & ceilings
Contract Terms
Duration, SLAs & penalties
Subsidies & Investments
Upfront commitments
Profitability
Engine
What you get back
Contribution Margin 1 (%)
Revenue minus direct traffic costs
Contribution Margin 2 (%)
After device subsidies and other direct deal costs
Contribution Margin 3 (%)
After all allocated costs
Deal Lifetime Value
NPV over full contract term
Service Level P&L
Per-service profitability
Auto-Routed Approval
Right level, instantly assigned

Not every customer behaves the same

A deal is only as profitable as the customer behind it. Two customers can buy the same products at the same price and still create different economics: their usage patterns differ, their traffic mix differs, their cost to serve differs.

For existing customers, Vincora can use actual consumption history. For new customers, behavioural profiling can match the prospect with relevant customer cohorts and project expected voice, messaging and data usage. Those projections become part of the profitability calculation.

The business is not evaluating an abstract price list. It is evaluating the expected economics of the customer and the deal together.

The result is not simply a quote. It is an economically evaluated deal.

Every view your team needs. One app.

Vincora adapts its interface based on who's logged in. Sales reps see their pipeline. Managers see their team. Approvers see their queue. Everyone sees the profitability.

Analytics & Insights
Offer Management
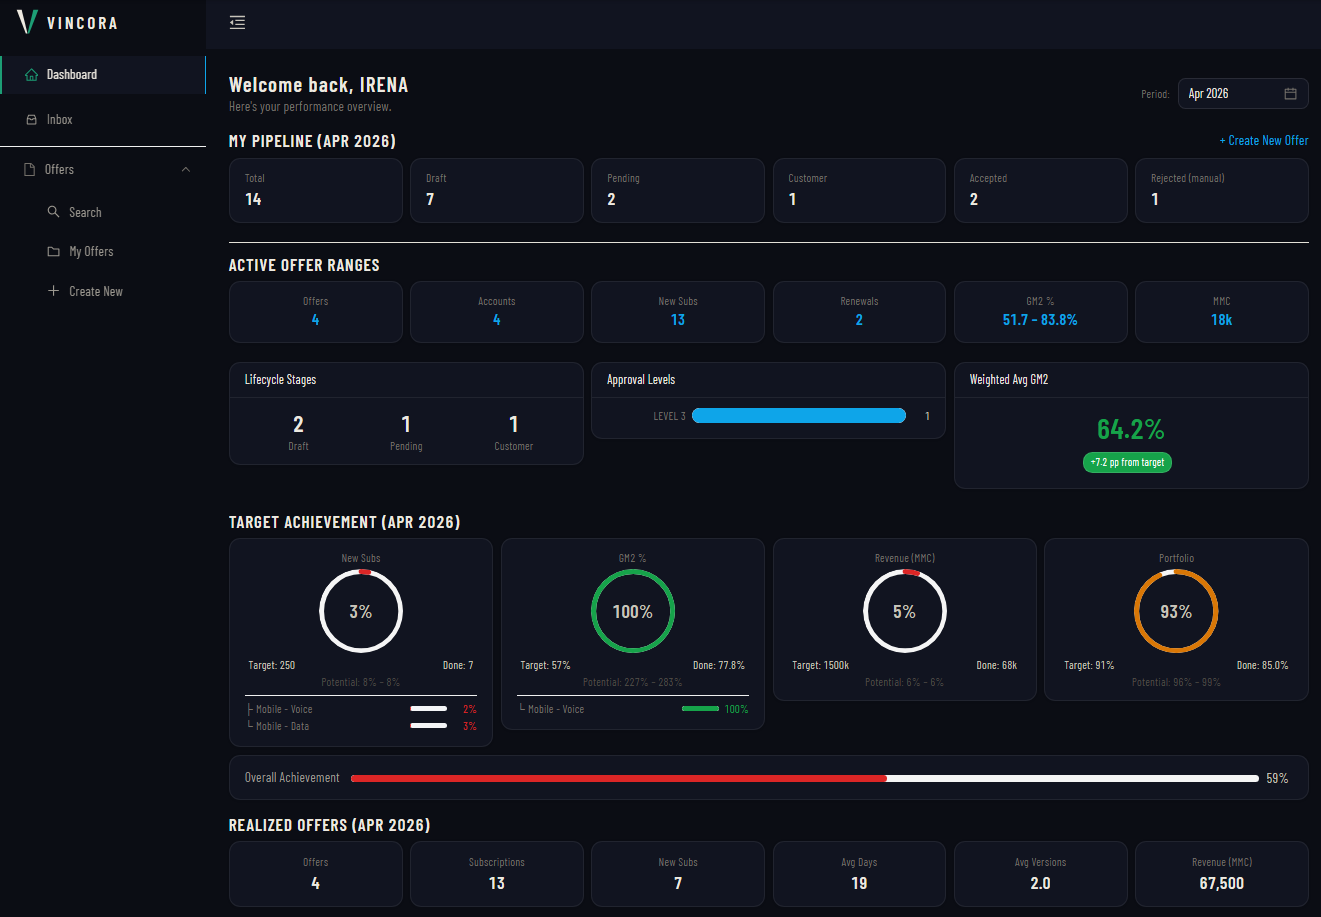
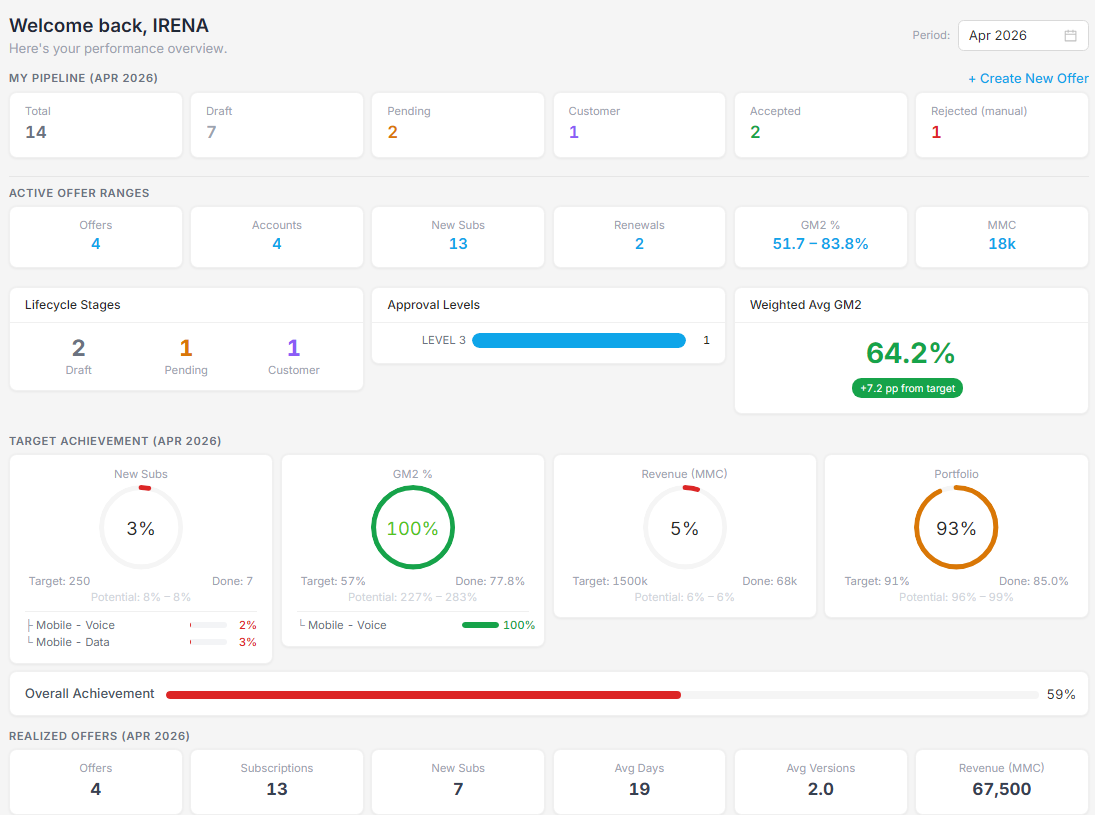
Vincora Dashboard: pipeline overview, target achievement, weighted CM2% Vincora Dashboard: pipeline overview, target achievement, weighted CM2%
Dashboard Role-adaptive overview. Sales reps see their personal pipeline and targets. Line managers see team performance. Bid managers see cross-channel operations and portfolio-level trends.
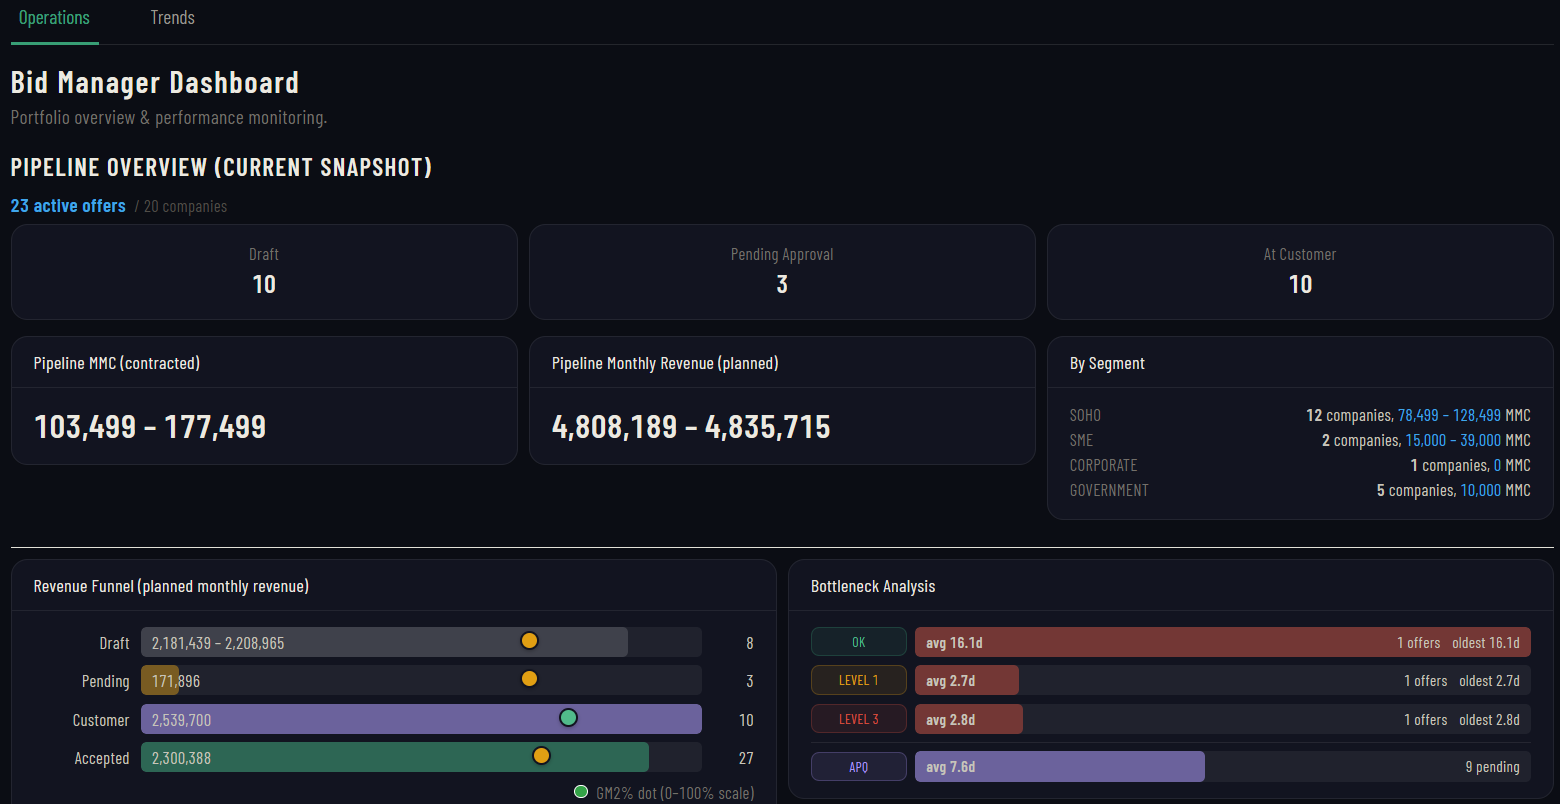
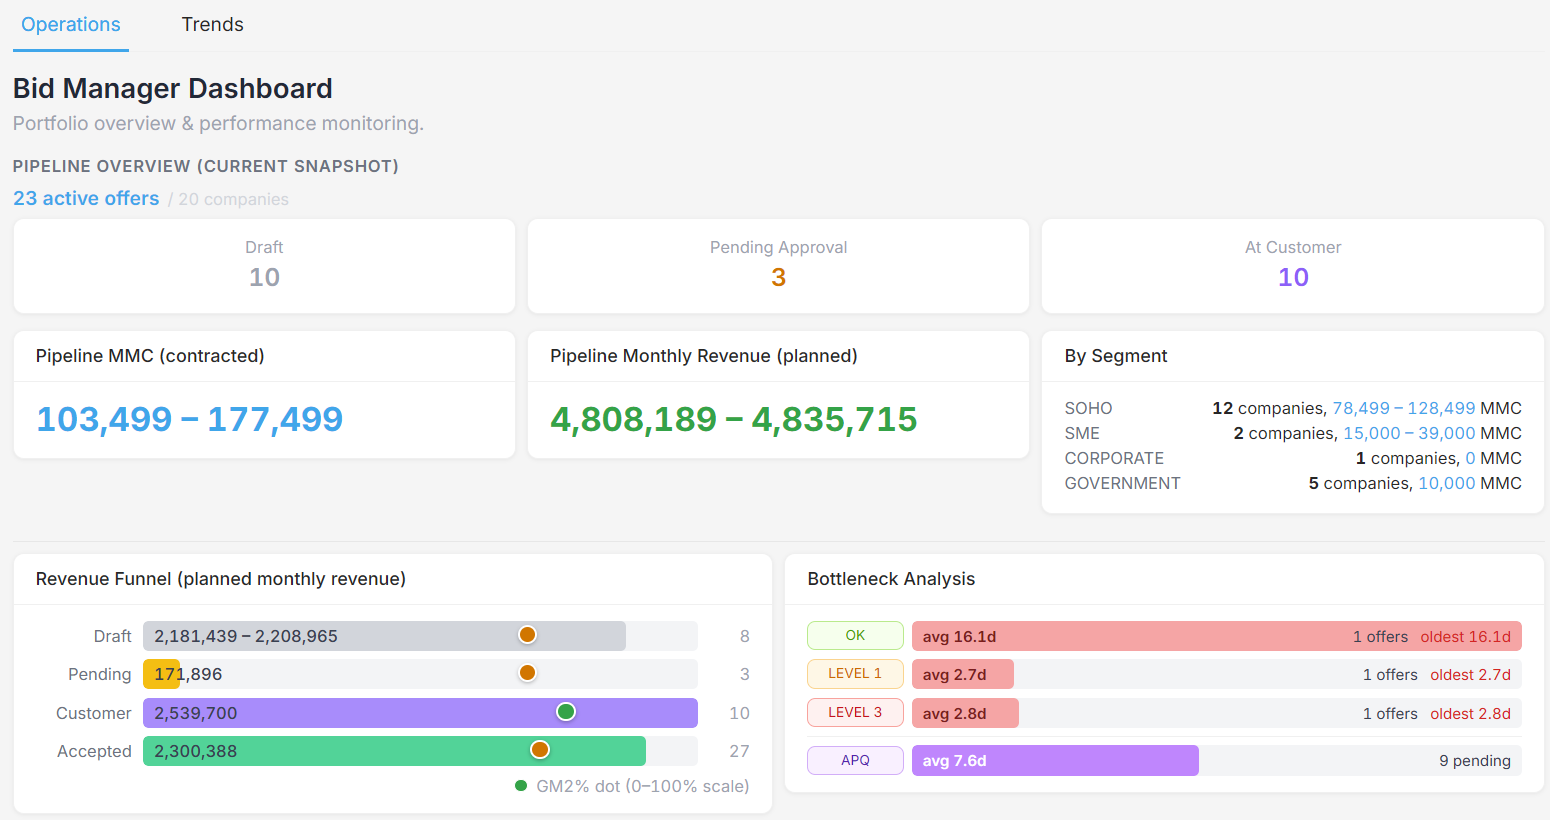
Bid Manager Dashboard: pipeline overview, revenue funnel, bottleneck analysis Bid Manager Dashboard: pipeline overview, revenue funnel, bottleneck analysis
Pipeline Bid Manager operations view: active offers by status, pipeline MMC and monthly revenue ranges, revenue funnel with CM2% indicators, and real-time bottleneck analysis showing approval queue depths by level.
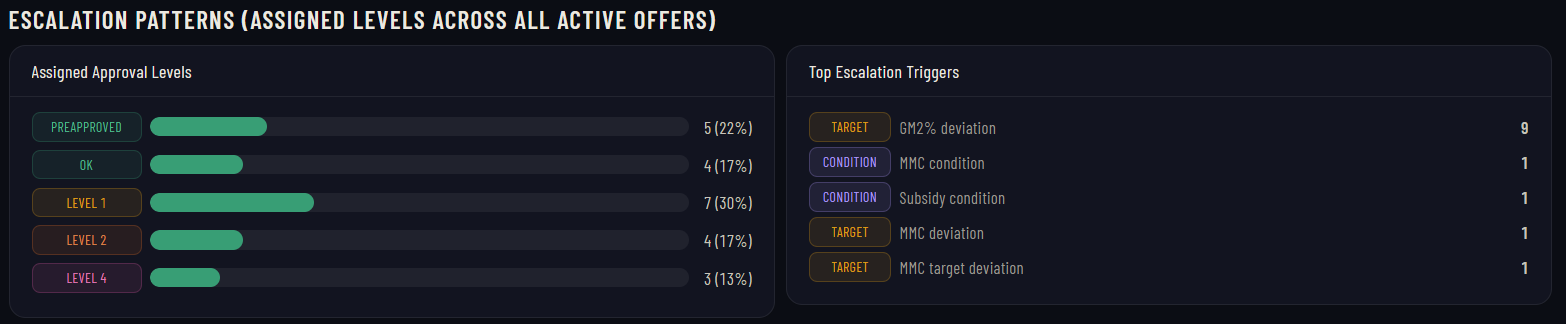
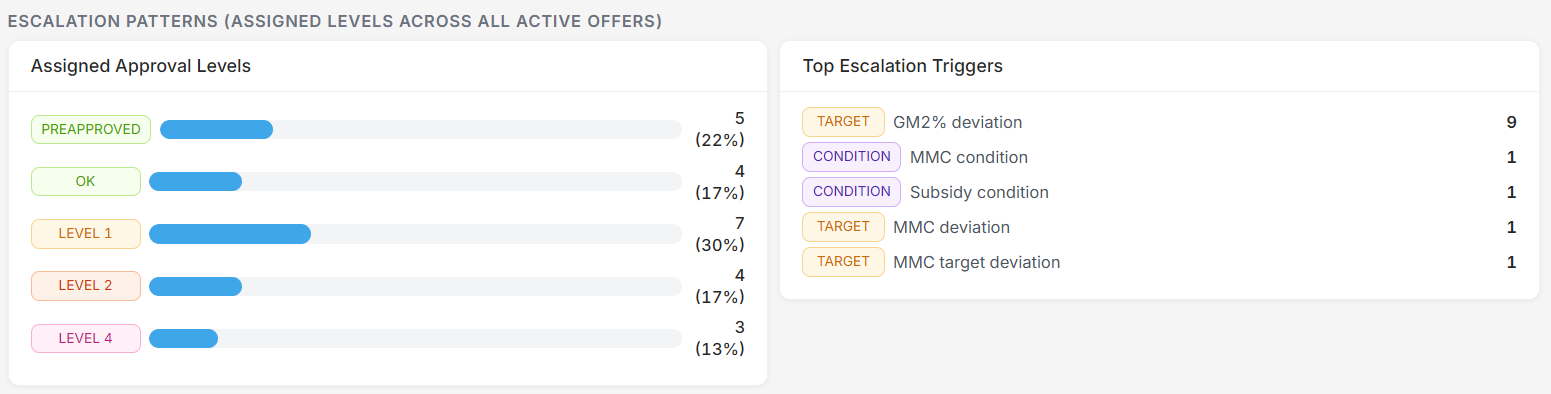
Escalation Patterns: assigned approval levels and top escalation triggers Escalation Patterns: assigned approval levels and top escalation triggers
Approvals Escalation pattern analysis: distribution of offers across approval levels (Preapproved through Level 4), and the top triggers driving escalation: CM2% deviation, MMC conditions, subsidy thresholds, and target deviations.
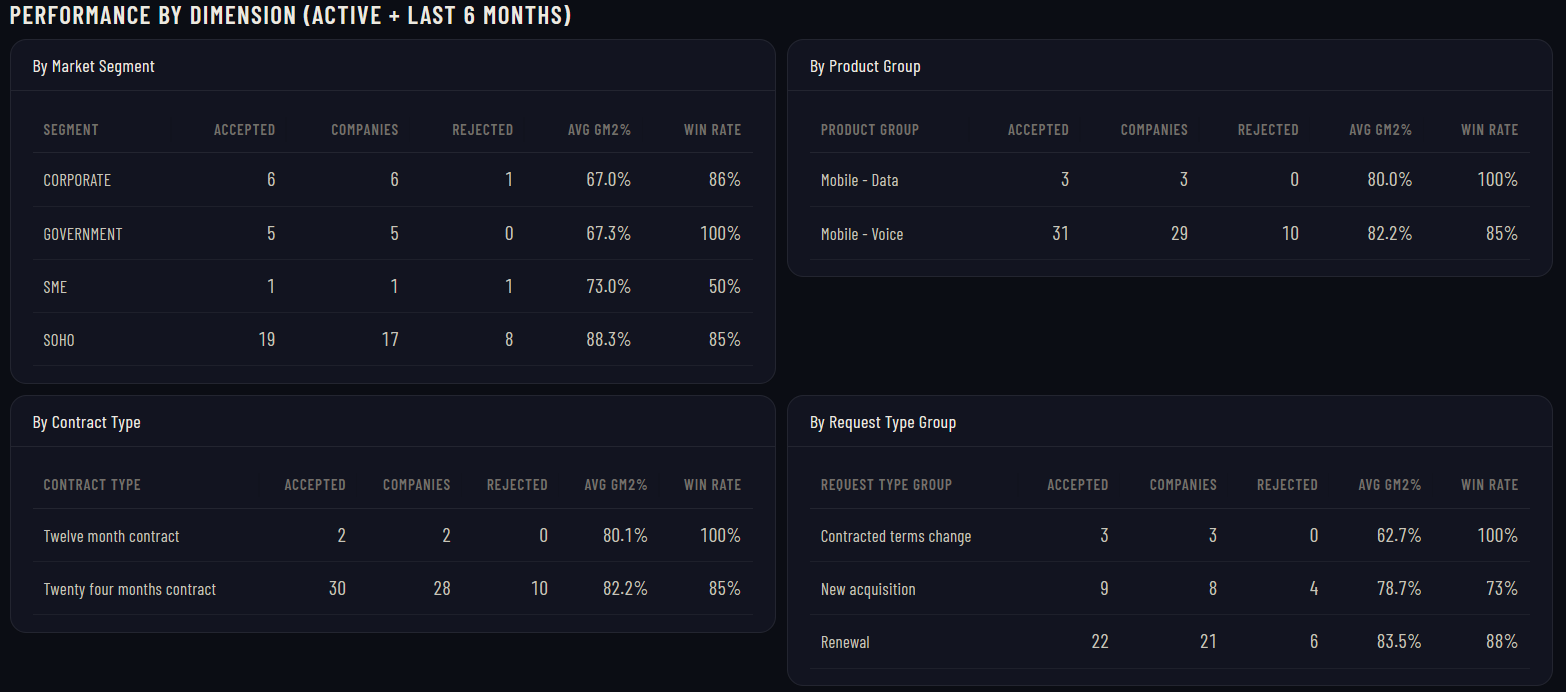
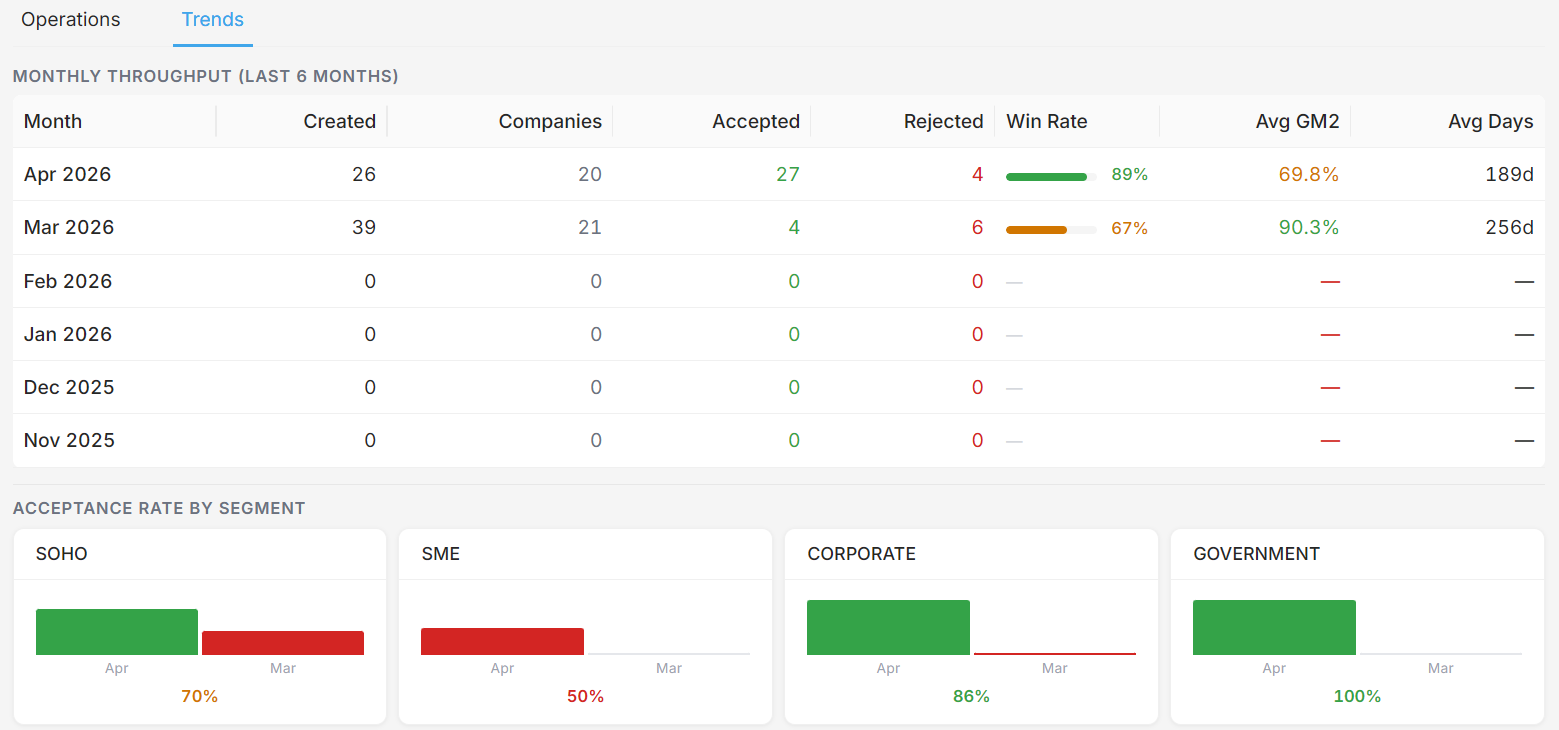
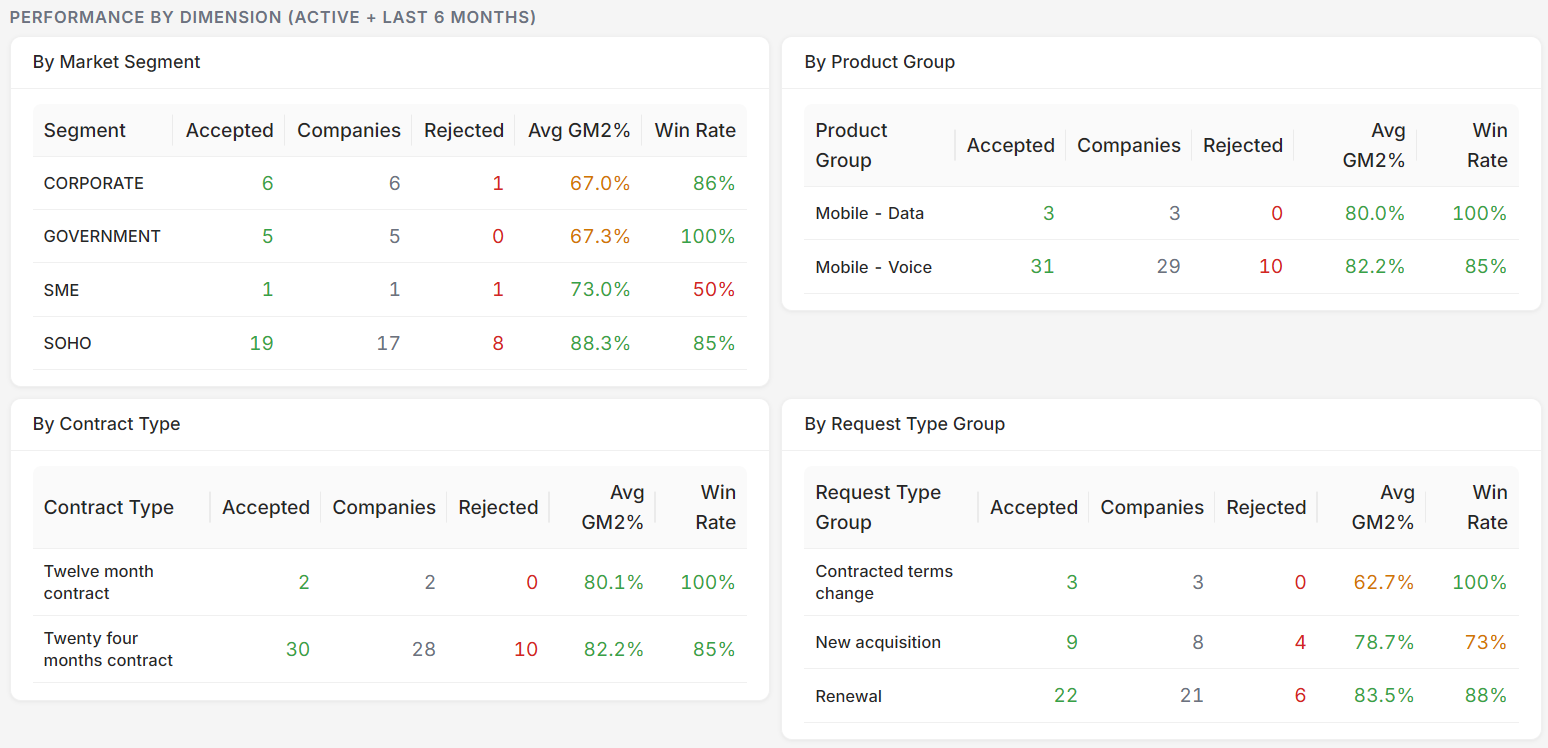
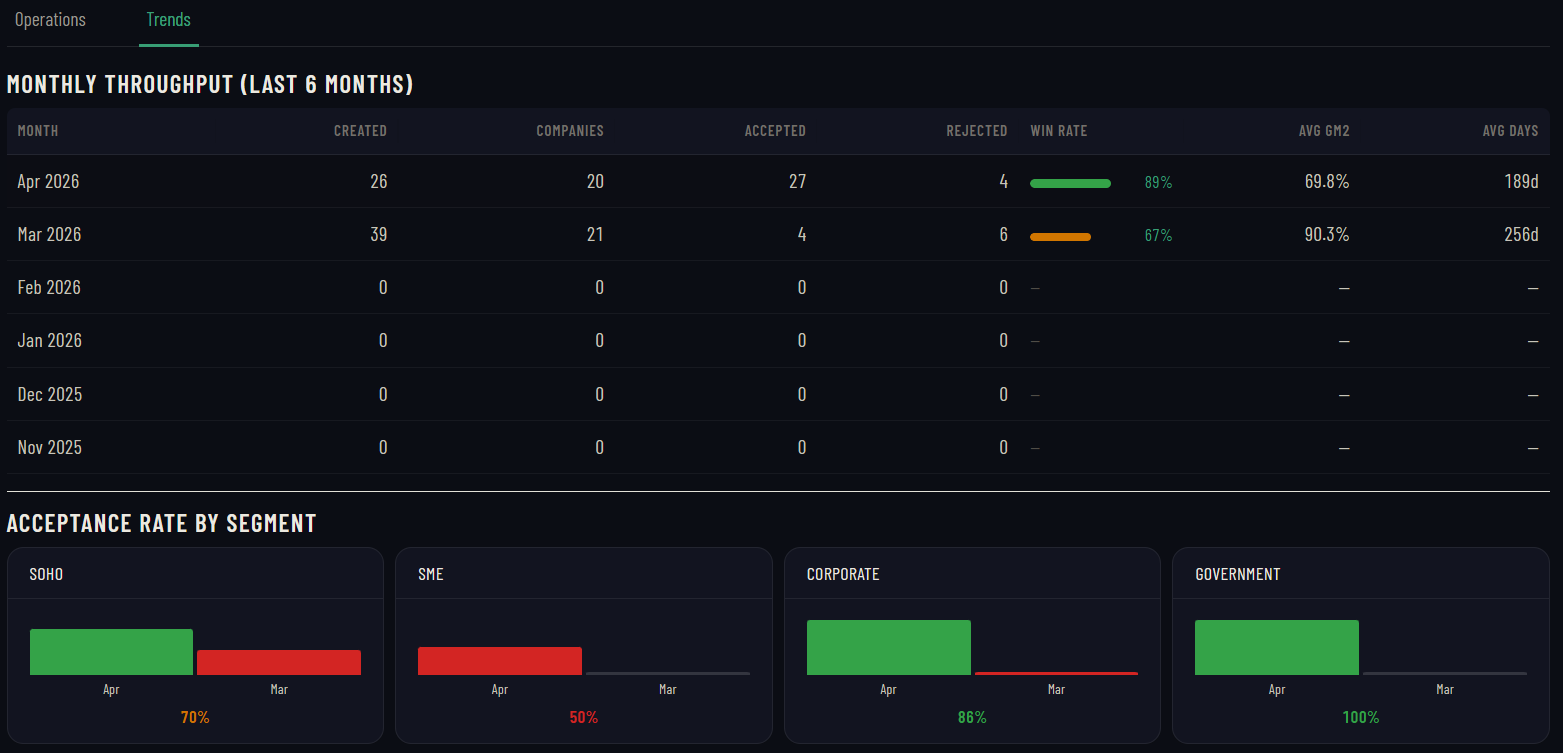
Performance by Dimension: segment, product, contract type, request type Performance by Dimension: segment, product, contract type, request type
Analytics Multi-dimensional performance: slice active and historical offers by market segment, product group, contract type, and request type, with accepted counts, average CM2%, and win rates for each dimension.
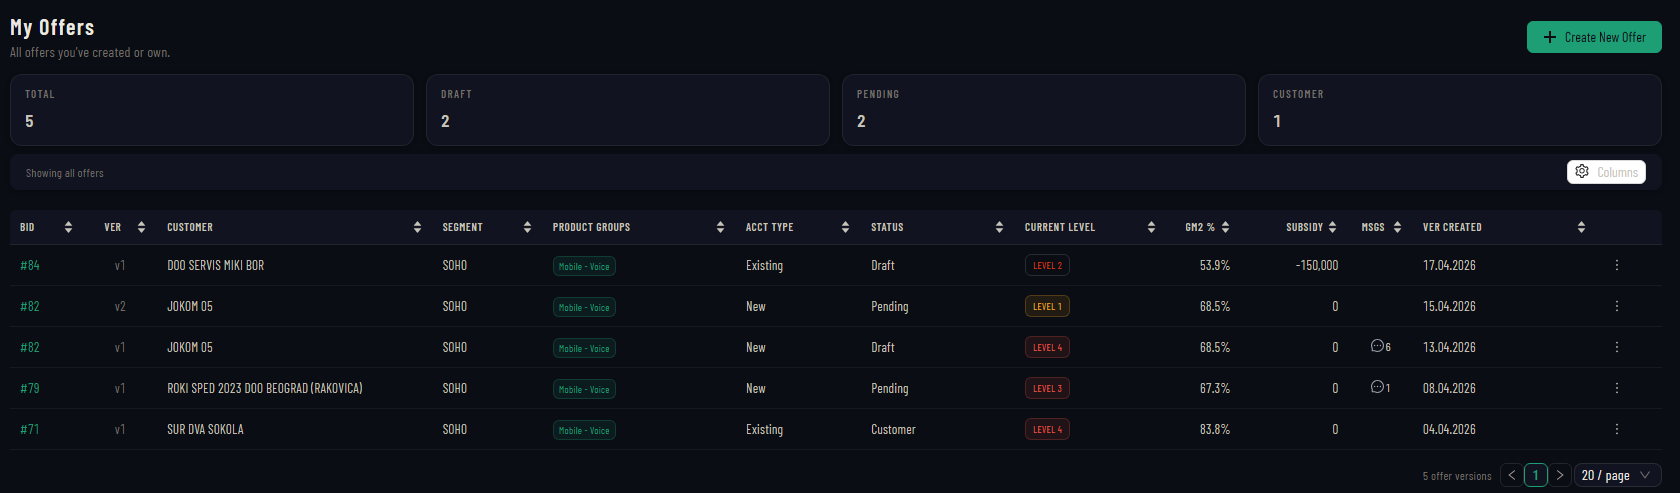
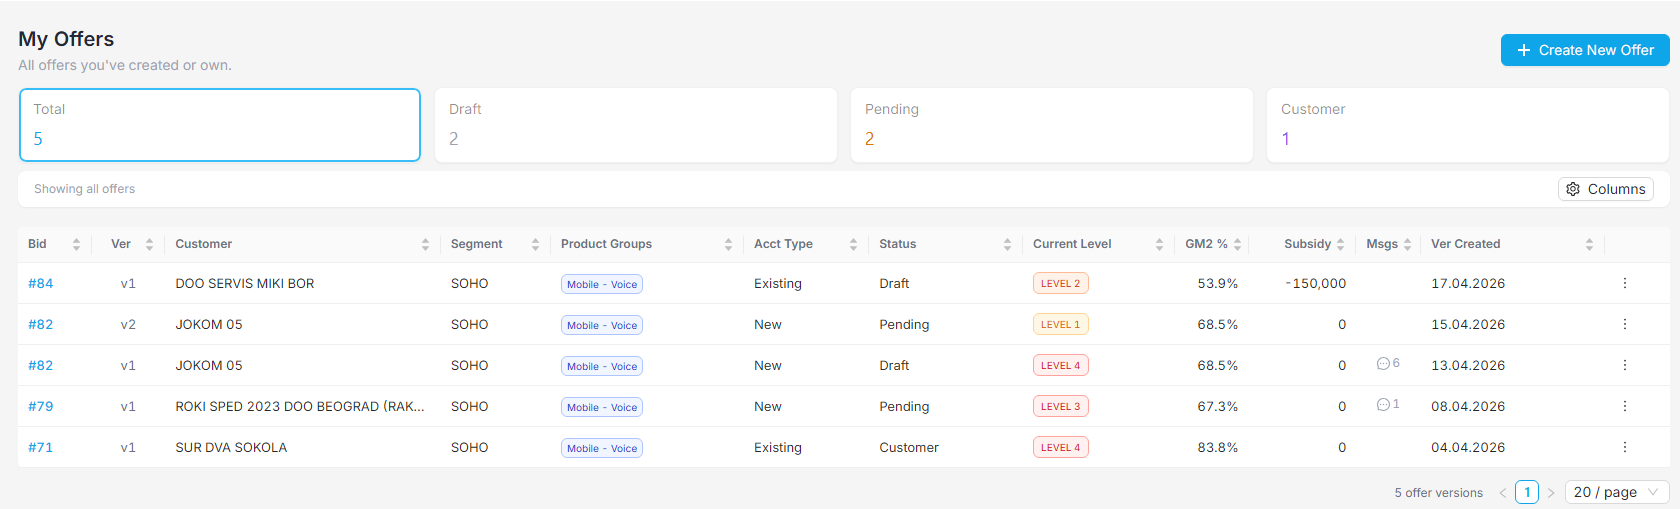
My Offers: status pipeline, sortable columns, CM2%, approval levels My Offers: status pipeline, sortable columns, CM2%, approval levels
My Offers Every offer you've created or own, with real-time status, CM2%, approval level, version tracking, and subsidy amounts. Filter by status, sort by any column, and create new offers in one click.
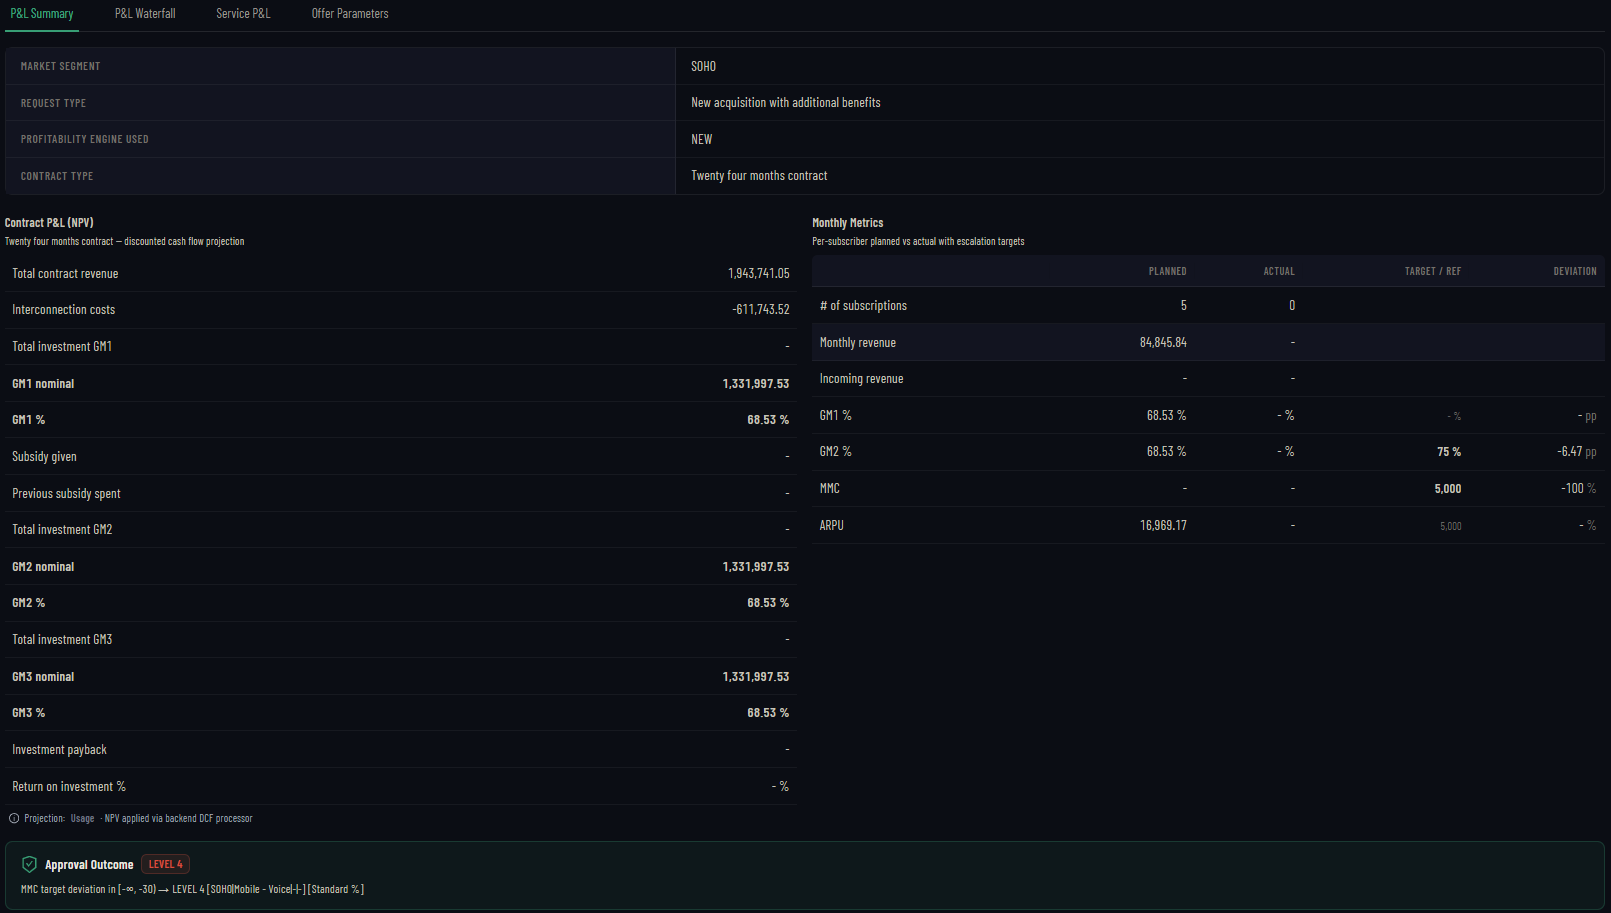
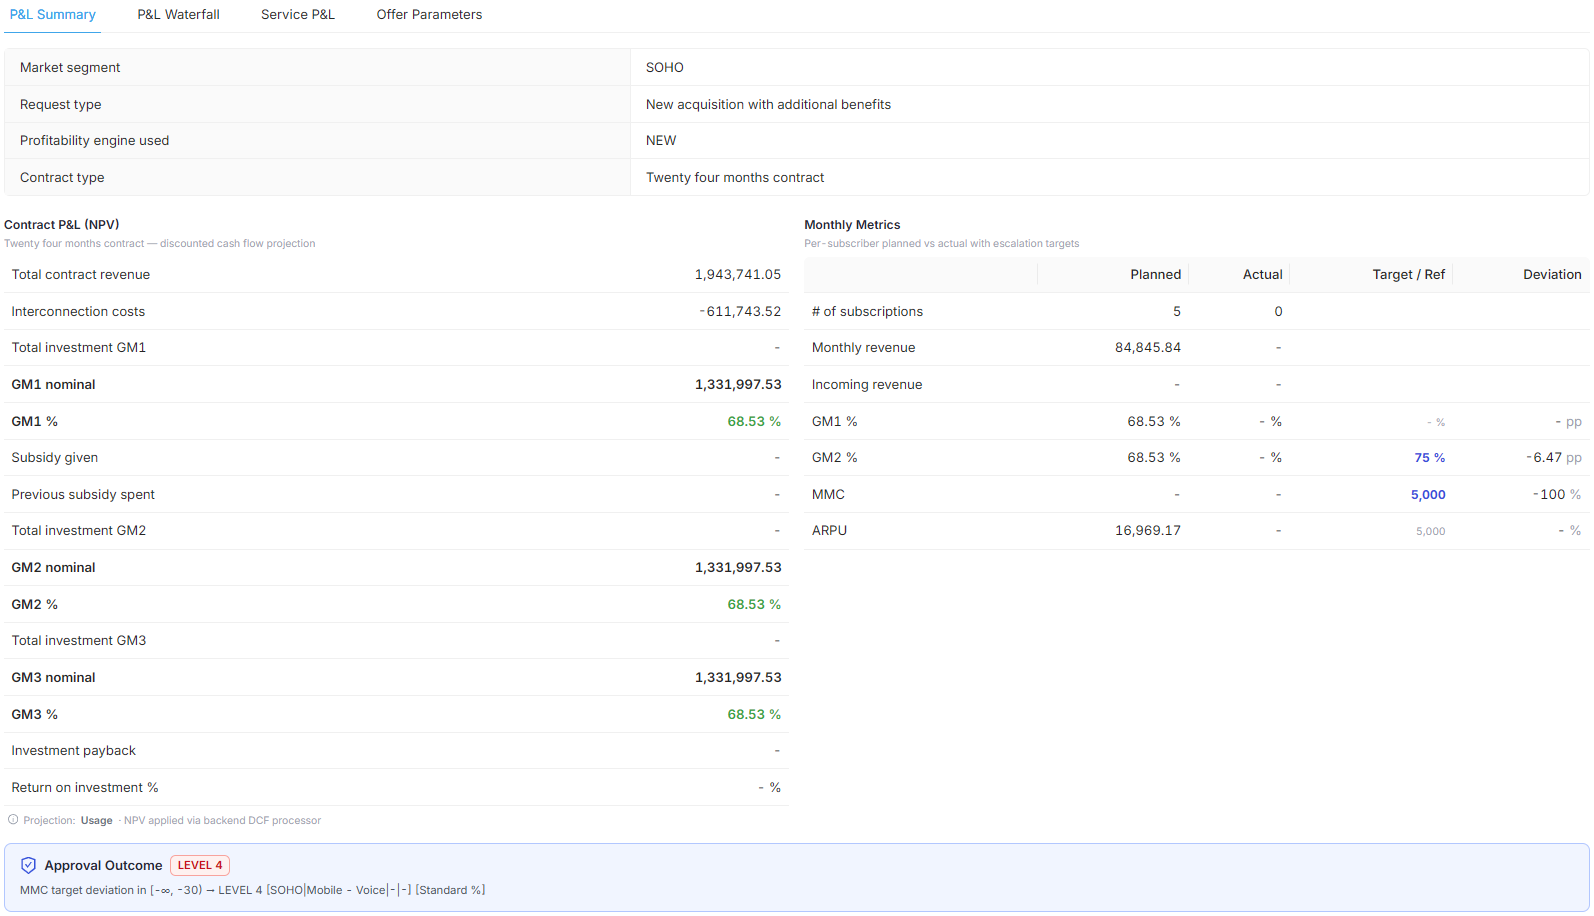
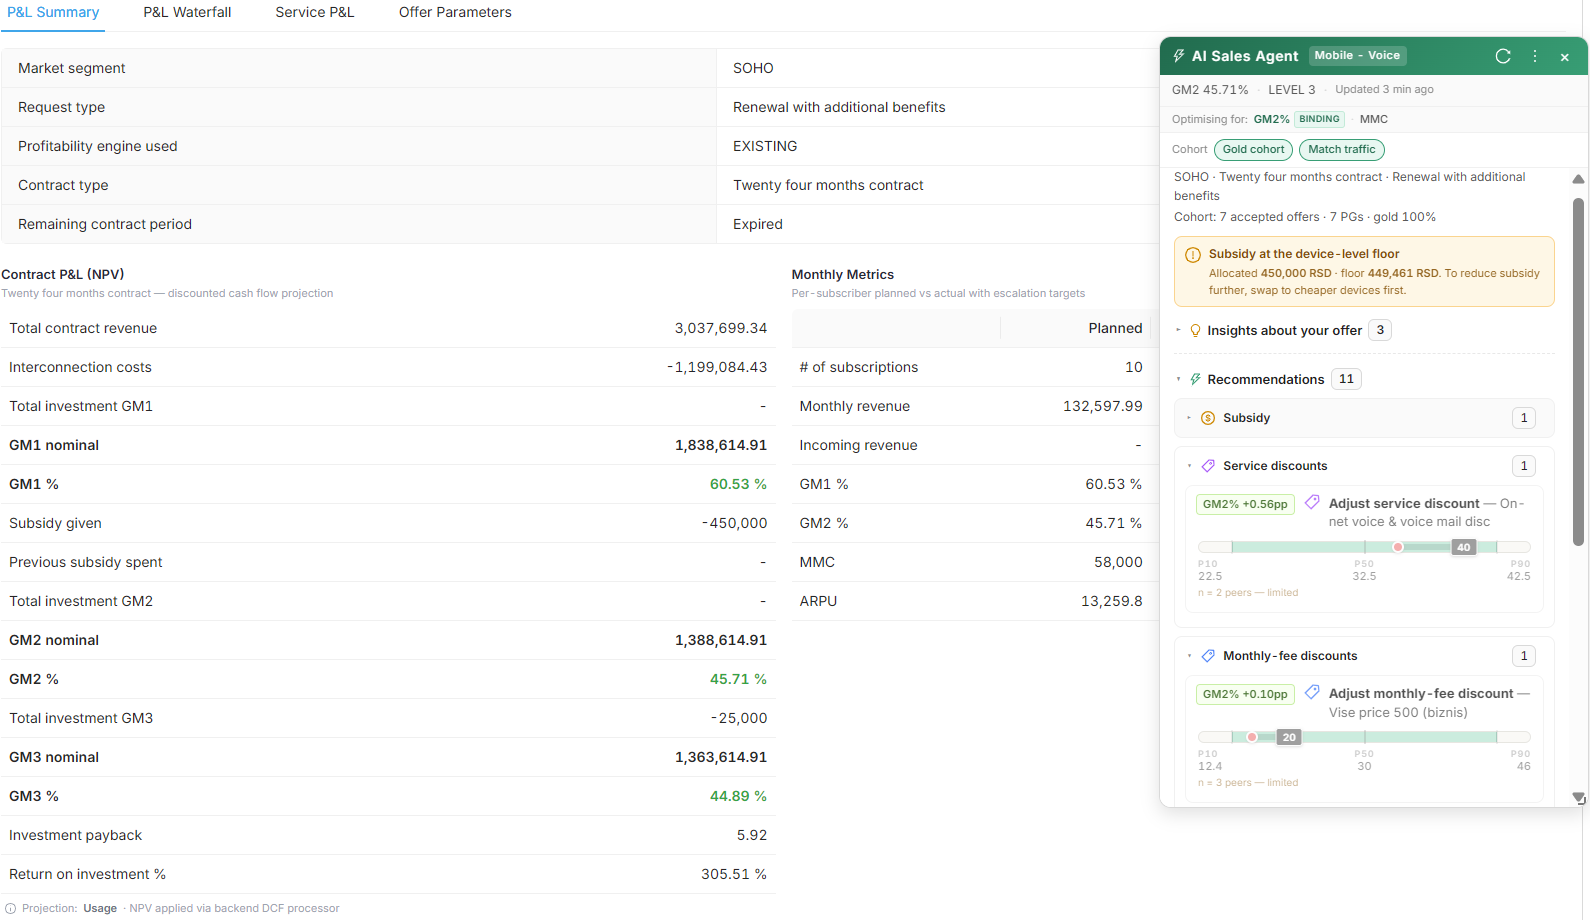
P&L Summary: Contract P&L NPV, monthly metrics, approval outcome P&L Summary: Contract P&L NPV, monthly metrics, approval outcome
P&L Summary Complete financial picture: contract revenue, interconnection costs, CM1/CM2/CM3 nominal and percentage margins across all three levels. Monthly metrics compare planned vs. actual with target deviations. Approval outcome with level routing displayed inline.
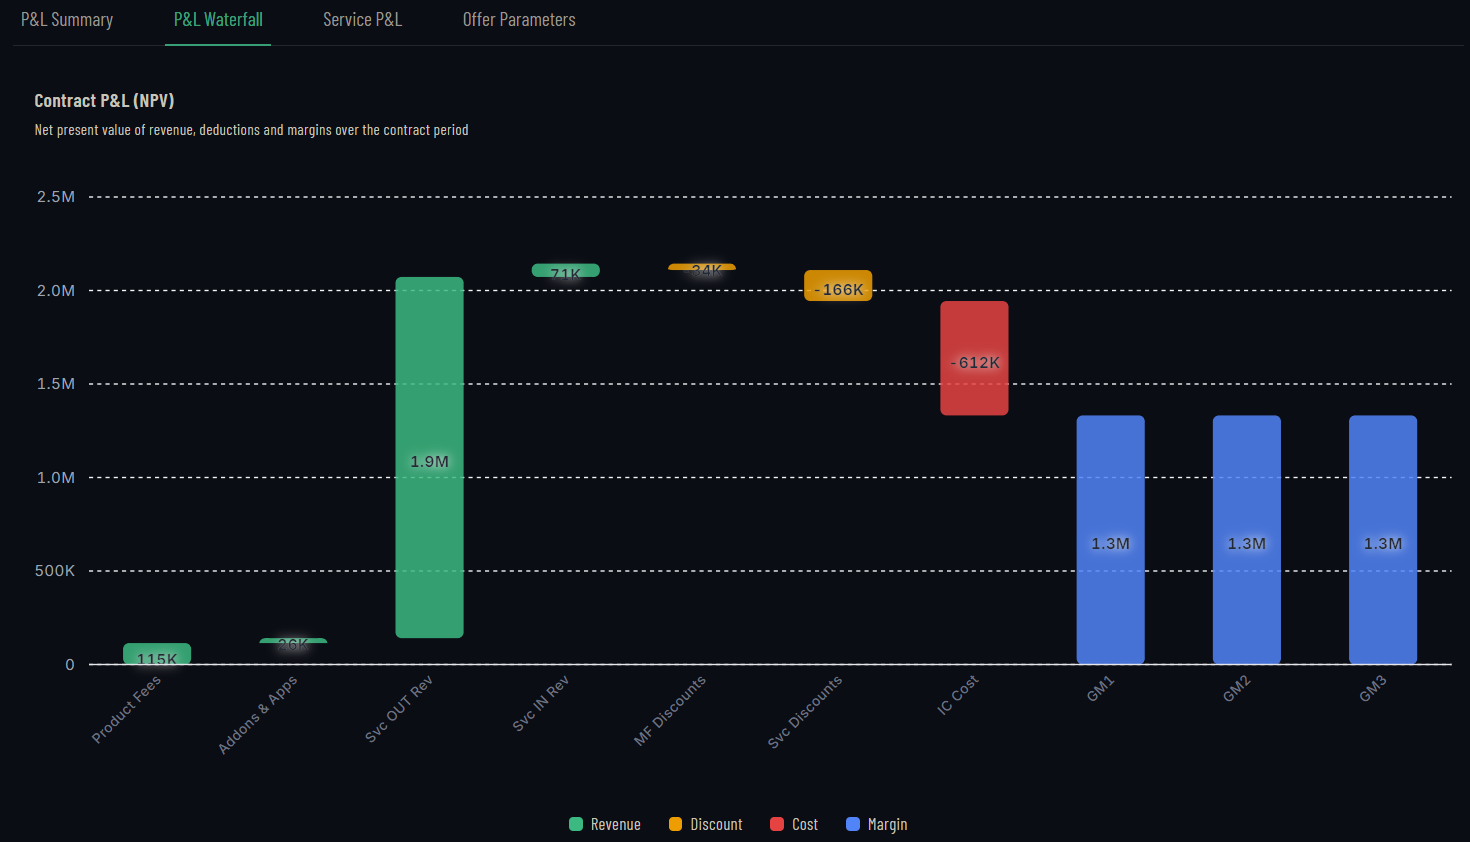
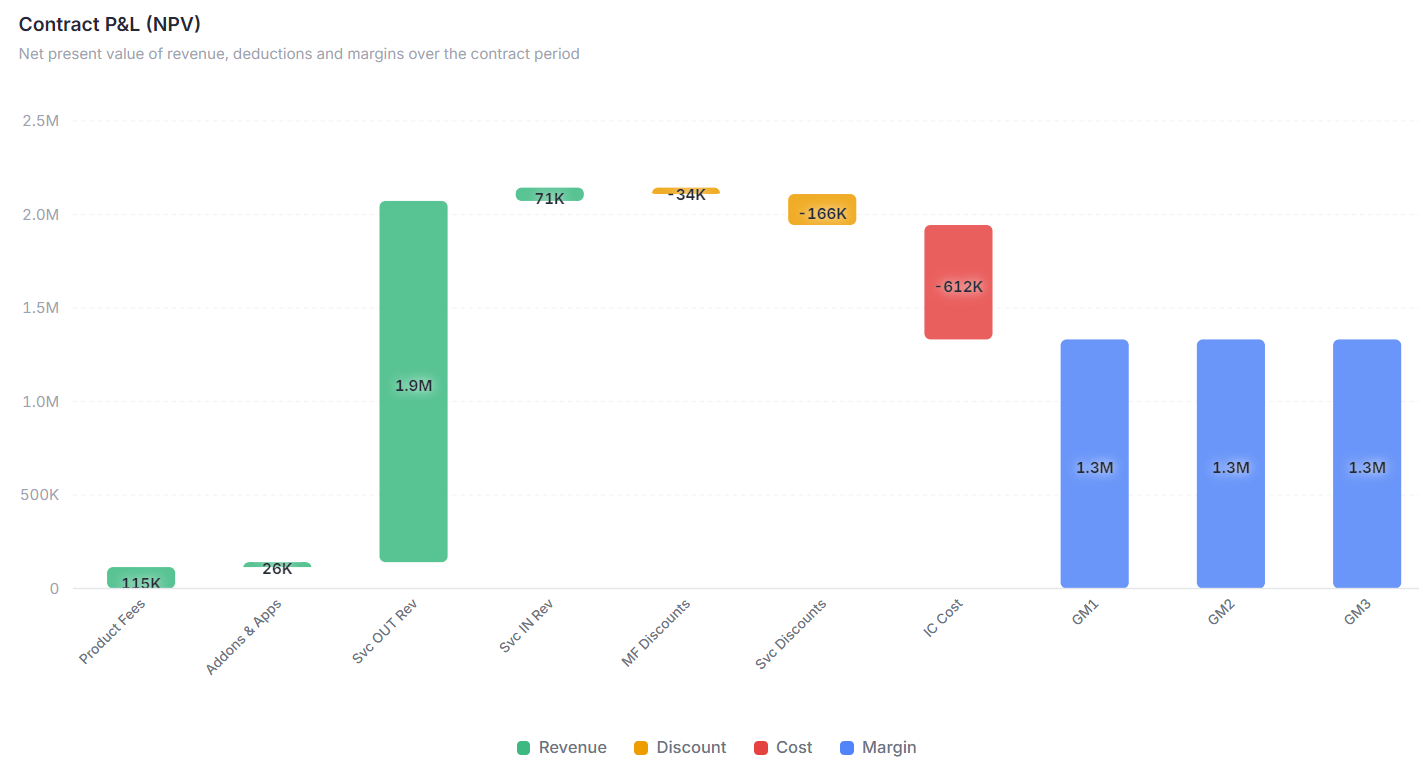
P&L Waterfall: Contract P&L NPV waterfall chart P&L Waterfall: Contract P&L NPV waterfall chart
P&L Waterfall Contract P&L as a waterfall: product fees, add-ons, service revenue (OUT/IN), discounts (MF/Svc), interconnection costs, and resulting CM1, CM2, CM3 margins. Color-coded by revenue, discount, cost, and margin. NPV applied via backend DCF processor.
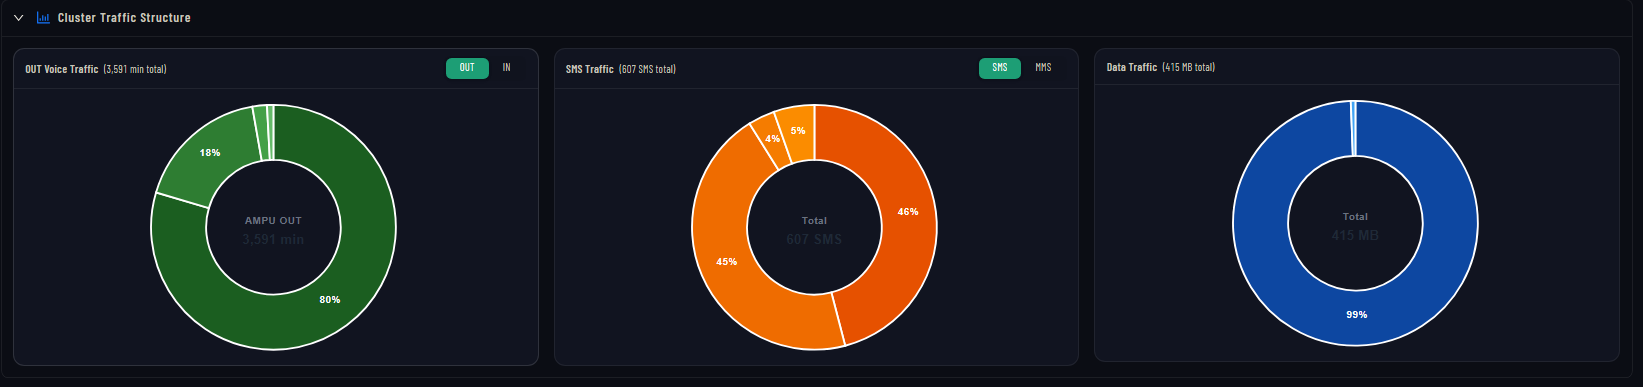
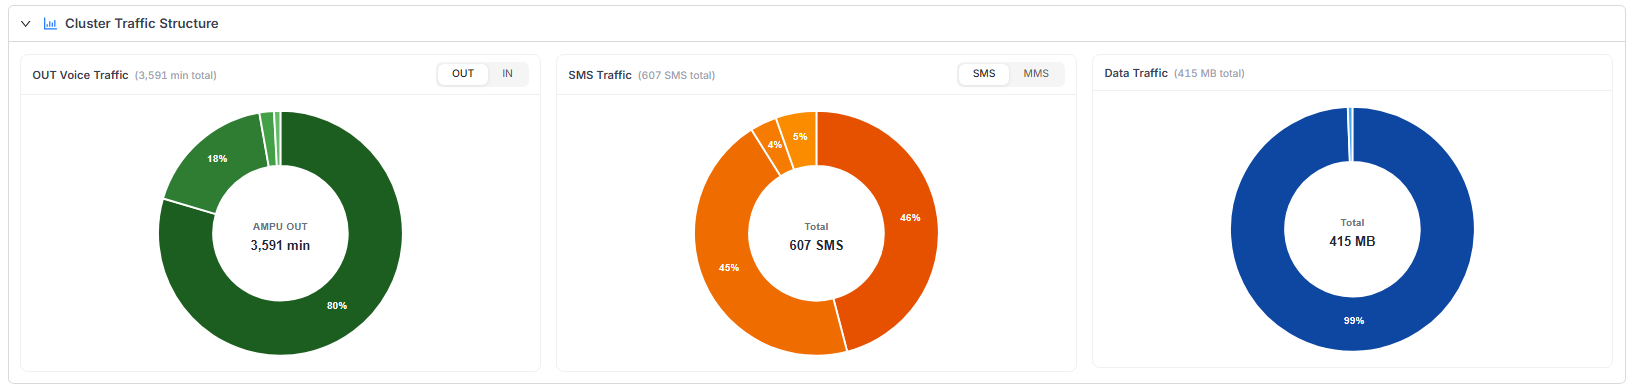
Traffic Analytics: voice, SMS, data donut charts per cluster Traffic Analytics: voice, SMS, data donut charts per cluster
Traffic Intelligence For existing customers, Vincora can use actual consumption history. For new customers, its criteria-based profile matching can identify a relevant behavioural cohort and project expected voice (IN/OUT), messaging (SMS/MMS) and data usage. Those projections become inputs to the offer’s revenue, cost and profitability model.
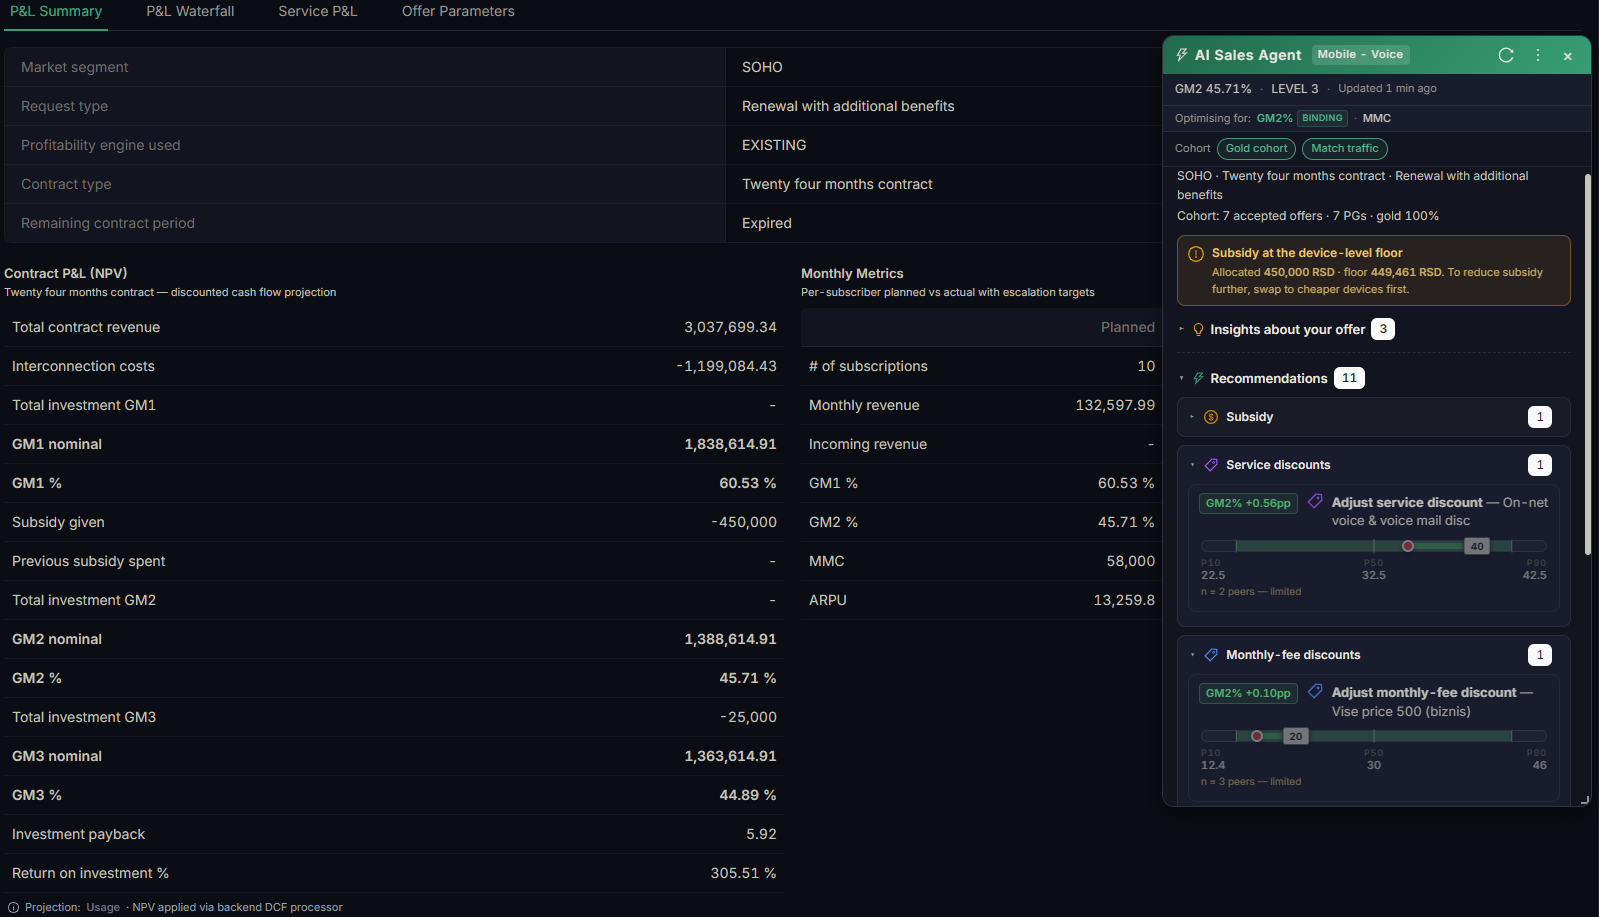
AI Sales Agent: cohort-matched discount recommendations with CM2% impact and percentile distribution AI Sales Agent: cohort-matched discount recommendations with CM2% impact and percentile distribution
AI Sales Agent Vincora uses cohort matching and historical deal patterns to suggest commercial alternatives. It can suggest discount combinations across service, monthly fee, add-ons and devices, while showing the expected CM2 impact and where each option sits within the P10–P90 range of comparable historically accepted deals.

Govern the outcome, not only the discount.

A large discount is not necessarily a bad deal. A small discount is not necessarily a good one. What matters is what the concession does to the economics of that specific deal. Vincora evaluates profitability against configurable commercial thresholds and routes the offer to the appropriate approval level. Deals that stay inside agreed economics move quickly. Deals that cross a threshold receive the scrutiny they require.

Margin-based approval levelsRoute offers by profitability and commercial rules.
Automatic escalationMove exceptions to the right decision level.
Full audit trailEvery revision, decision and approval stays visible.
Configurable governanceYour thresholds, your rules, your responsibilities.
Bid Preparation
Agent
creates
LM
Line Mgr
APQ
APQ
approve reject
Approval
L1–L4
Escalation
levels
approve reject escalate
Customer
Feedback
pending
Accepted

Commercial governance becomes part of the sales process, rather than a review performed after it.

Commercial discipline should make selling easier.

Sales teams should not need separate spreadsheets, financial models and long email chains to know whether a deal works. Sales gets speed: structured offer creation, immediate profitability feedback, fewer unnecessary approval loops. Management gets control: visibility into deal economics, exceptions, pipeline quality and team performance. Controlling gets consistency: one profitability logic across offers, customers and sales teams.

Admin Console

Back-office / Configuration

A dedicated admin app lets authorised users manage product, pricing, approval, escalation, notification and document configuration directly.

Products, addons, services, devices (full CRUD)
Pricing rules: fee bands, device ranges, bulk pricing
Escalation rules & deviation templates
Approval levels × channels assignment
PE metrics, targets & reference KPIs
Notification routing & event rules
Document templates (proposal & contract)
DCF rates, SLA thresholds, system-wide config

Agent App

Everyone who touches an offer

One app, six roles. The interface adapts based on who's logged in: sidebar, dashboard, and available actions all change per role.

Agent · creates offers, runs PE calc, submits
Line Manager · first approval gate, team pipeline
APQ · second approval gate
OK / Level 1-4 · escalation-tier approvers
Bid Manager · cross-channel oversight, reassignment
Controlling · read-only audit access

Bid Manager

Process Owner / Oversight

Full visibility across all channels and teams. The bid manager sees every offer, every approval chain, and can intervene when needed.

Cross-channel offer search & filtering
Agent reassignment between teams
Portfolio-level analytics & trends
All notification streams (global view)
Operations dashboard variant
Approval escalation override

One process. One economic logic. One view of the deal.

Built around the way your business actually sells.

Telecom operators differ in products, pricing, profitability models, approval structures and responsibilities. Vincora is designed to configure those differences rather than hard-code them: product structures, pricing rules, profitability thresholds, approval levels, escalation logic, notifications, document templates and financial parameters, through the administration environment.

5 months
planned to go-live
Months, not years, because the rules are configured, not built. Pricing, approval chains and escalation logic are set in the admin app, so a Vincora programme carries none of the custom-development tail that makes most CPQ implementations in telecom run long. The schedule on our side is a four-week Feasibility & Impact Assessment, four months of delivery after it, and production in the sixth. What moves that date is on yours: how quickly data, rules and approvers can be made available. Establishing exactly that is the first thing the Assessment does. Nothing is recovered before go-live, which is where the payback clock in the assessment below starts.

Your commercial logic should belong to your business, not to your software vendor.

How much is your commercial process worth defending.

The figures below are yours, not ours. Set your own volumes, contract values and the share of margin you believe leaks, and the assessment shows the scale of that exposure over a year. On the same assumptions, it also shows how long a governed process would take to pay for itself.

Nothing here is a quotation and nothing is a promise. Establishing these figures on your own contract mix, discount governance and approval history is what the Feasibility & Impact Assessment is for.

Your Own Figures, Over a Year

Margin Exposure / Year
€1.502.550
~40% effective in the first year, with the full 45% from month 4 of production
Contracts Won / Year
5.040
From 14.400 offers issued, all scored in real time
Indicative Payback
Under 12 months
Based on the assumptions entered above.
Your Sales Operation
Contract & Margin
Commercial Model
Reduce upfront investment. Vincora participates in the margin recovered. Check eligibility
What this means for you
A high-level indication,
not a quote.
These figures are modelled on industry benchmarks and the parameters you entered, and they cover recovered margin only. Recovery is counted from go-live, which a Vincora programme is planned to reach five months after signature: four weeks of assessment, then four months of delivery.

Each of these parameters is examined in depth and established in the Feasibility & Impact Assessment, against your own contract mix, discount governance, approval structure and data. The Assessment also brings in what this calculator leaves out: process automation, fewer pricing errors and faster approvals, all of which work in the same direction.

For context, Bain's experience in B2B sales is that a company not actively managing price today is leaving 200–400 basis points in operating profit on the table. Bain & Company, „Dynamic Pricing: Building an Advantage in B2B Sales". The figure you set above is your own assumption, not that number.

Born inside a live telco bid desk.

Vincora did not start as a generic software concept. Its foundations were built inside the B2B sales operation of a national telecom operator, where complex offers had to bring together products, customer behaviour, pricing, discounts, investments, profitability and multi-level approvals. The challenge was not how to create a quote. It was how to give Sales enough flexibility to compete while giving management confidence that the deal still made economic sense.

“

Quoting used to hold us back. Since we implemented the bid management platform, every B2B deal flows through a single, structured, automated process with margins visible already from the first draft. Sales agents create proposals independent of location or device, the system forecasts profitability in real-time, verifies it against configured KPI thresholds and routes it to the right approval level. Management monitors team performance in real time and pricing regularly sharpens market positioning using latest market trends and years of won and lost deals. All this resulted in faster turnaround, healthier margins, and stronger commercial control. What began as a quoting tool is now the foundation of our B2B operation.

”
YF
Yorgos Fragioudakis
B2B Executive · Leading national mobile operator, Southeast Europe

Deploy on your cloud. Your rules.

Vincora runs on all major cloud platforms as well as on-premise. Your data stays where your compliance and sovereignty requirements demand.

AWS
Amazon Web Services
Google Cloud
GCP
Microsoft Azure
Azure Cloud
Oracle Cloud
OCI
IBM Cloud
IBM Cloud
On-Premise
Your data center

Before the next offer goes out,
know what it is really worth.

See how Vincora connects offer creation, customer economics, profitability and commercial governance in one telecom B2B workflow. No generic software pitch: let's look at how your B2B deals are actually structured, evaluated and approved.

Request a Demo

We'll be in touch within one business day.

This site is protected by reCAPTCHA and the Google Privacy Policy and Terms of Service apply.

No spam. No obligation. Just a conversation about your pipeline.