See It in Action
Every view your team needs. One app.
Vincora CPQ adapts its interface based on who's logged in. Sales reps see their pipeline. Managers see their team. Approvers see their queue. Everyone sees the profitability.
Analytics & Insights
Offer Management
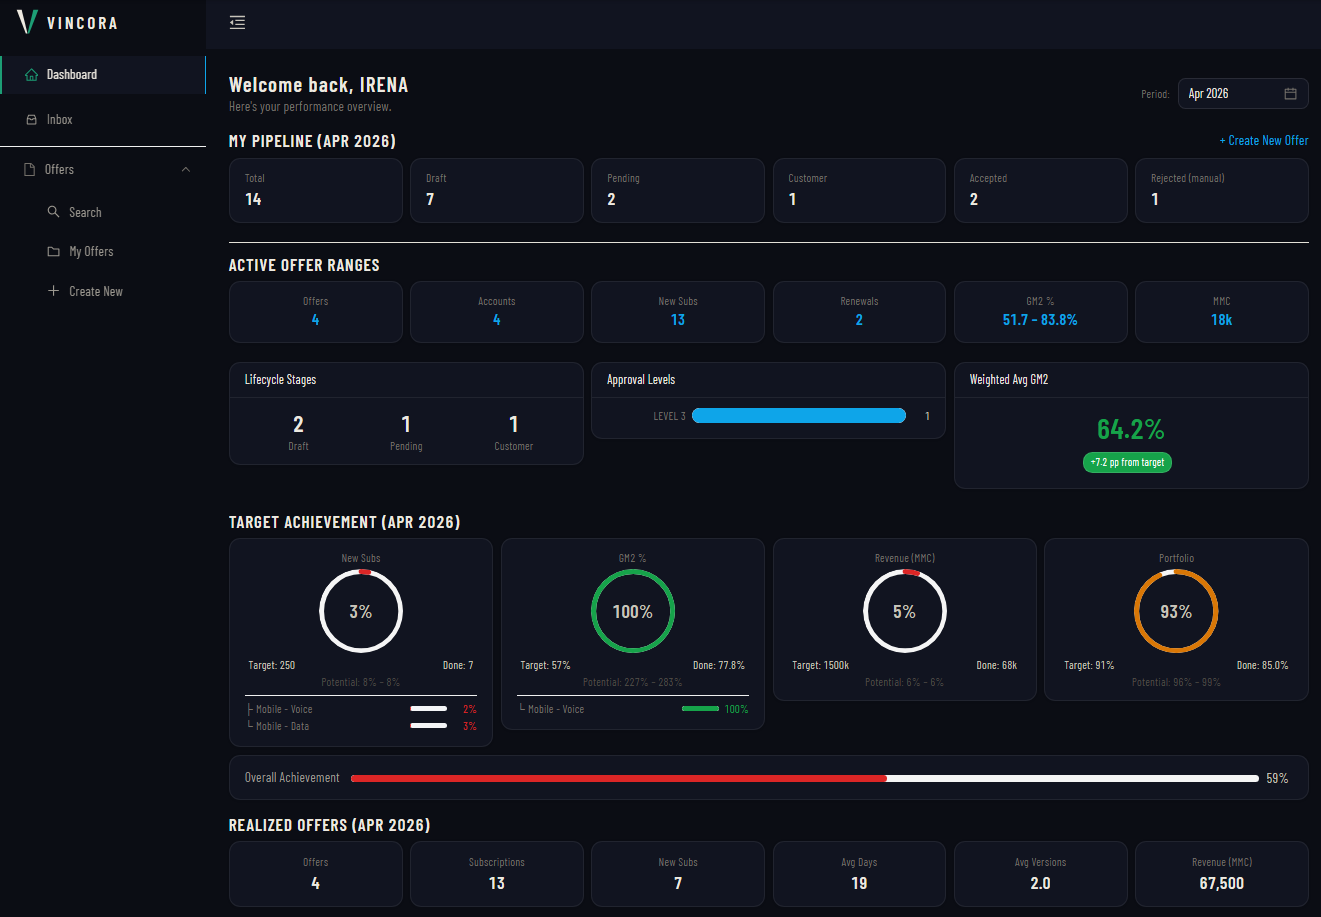
Dashboard
Role-adaptive overview. Sales reps see their personal pipeline and targets. Line managers see team performance. Bid managers see cross-channel operations and portfolio-level trends.
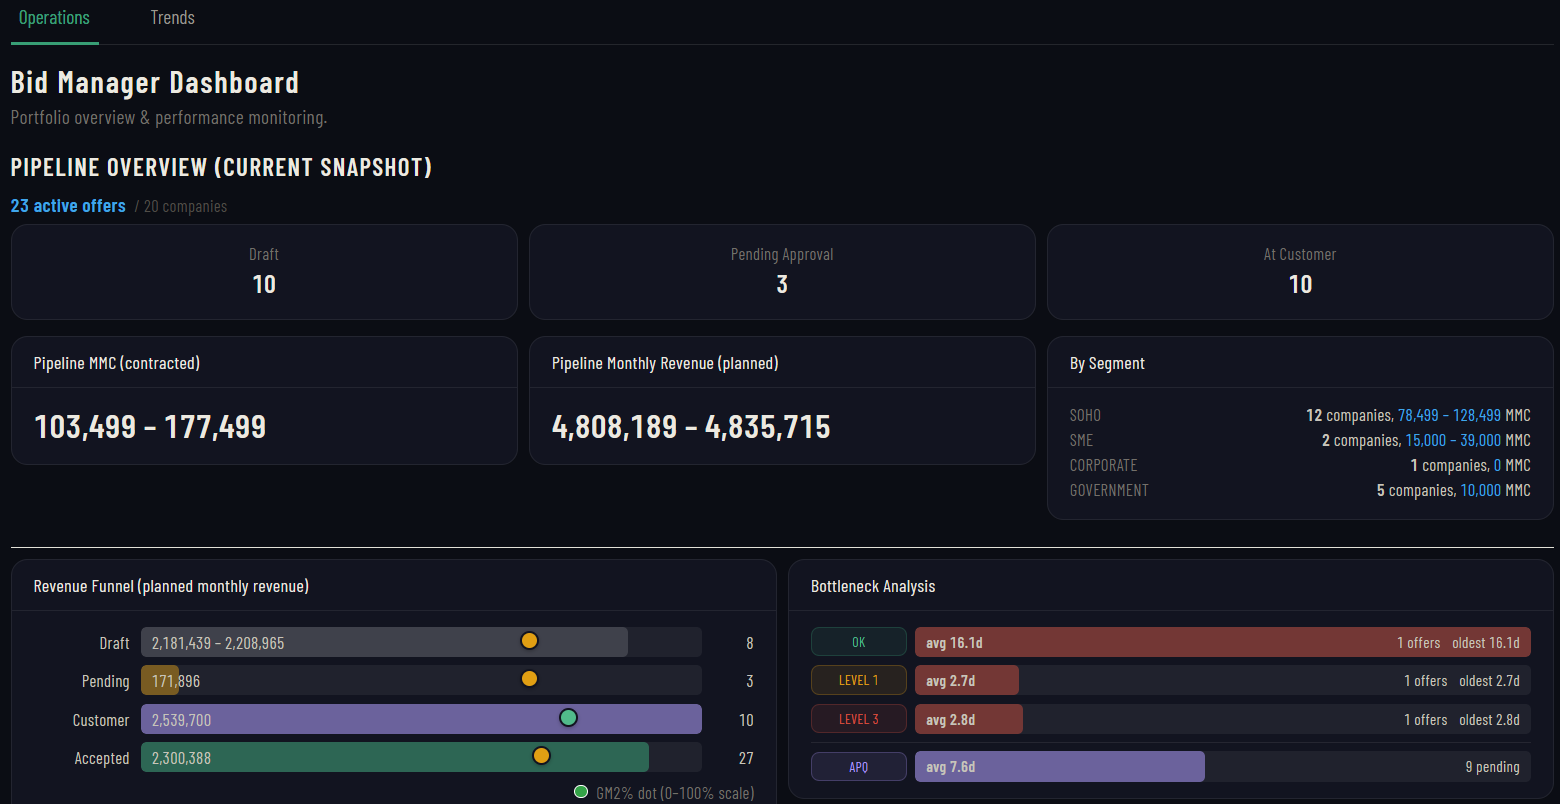
Pipeline
Bid Manager operations view: active offers by status, pipeline MMC and monthly revenue ranges, revenue funnel with CM2% indicators, and real-time bottleneck analysis showing approval queue depths by level.
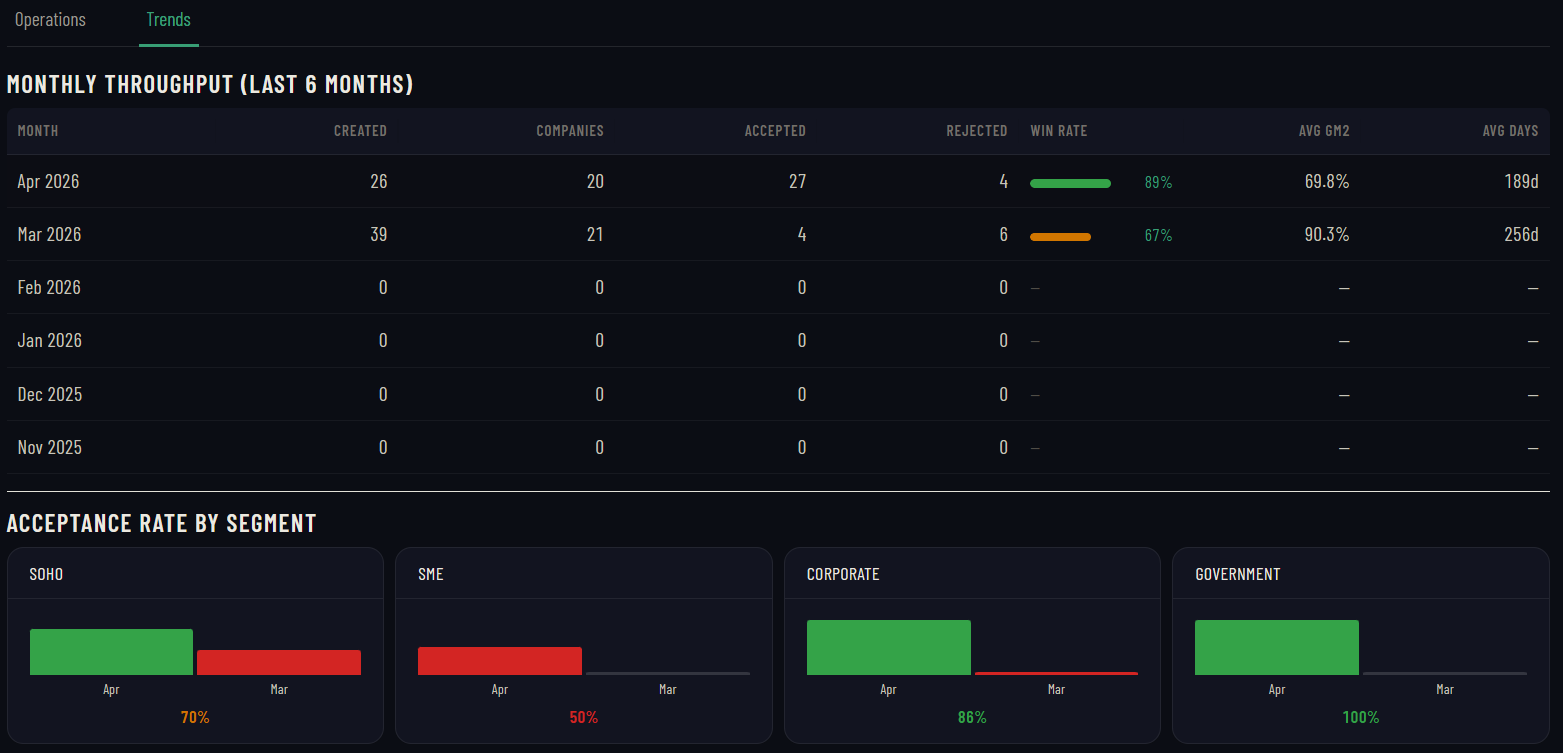
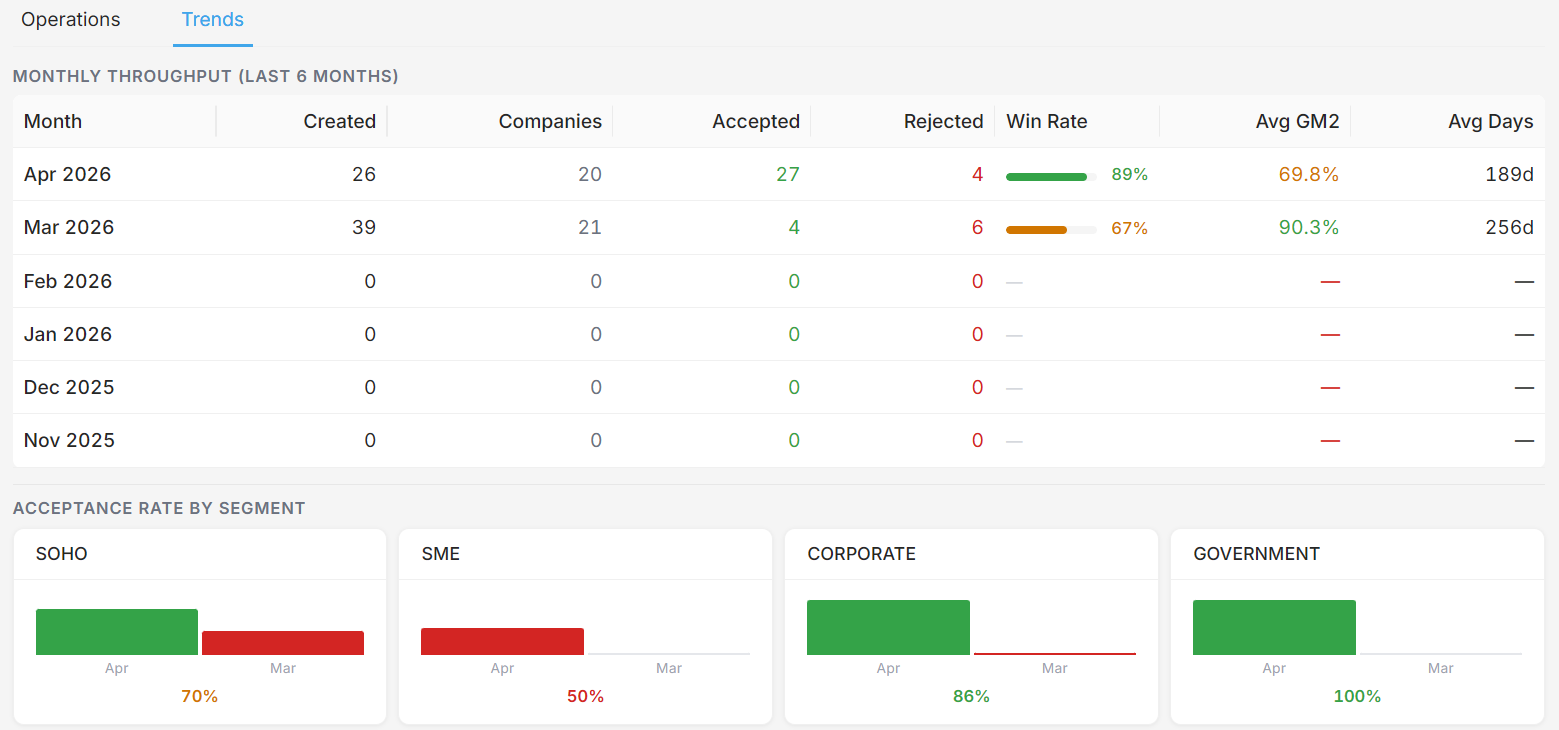
Trends
Six-month throughput: offers created, companies engaged, accepted, rejected, with win rate bars and average CM2%. Plus acceptance rate by segment (SOHO, SME, Corporate, Government) for month-over-month comparison.
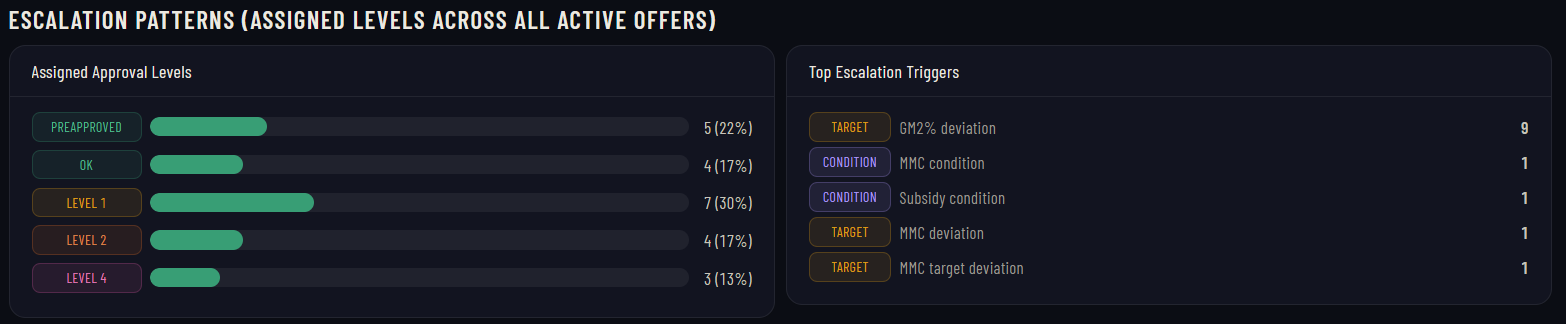
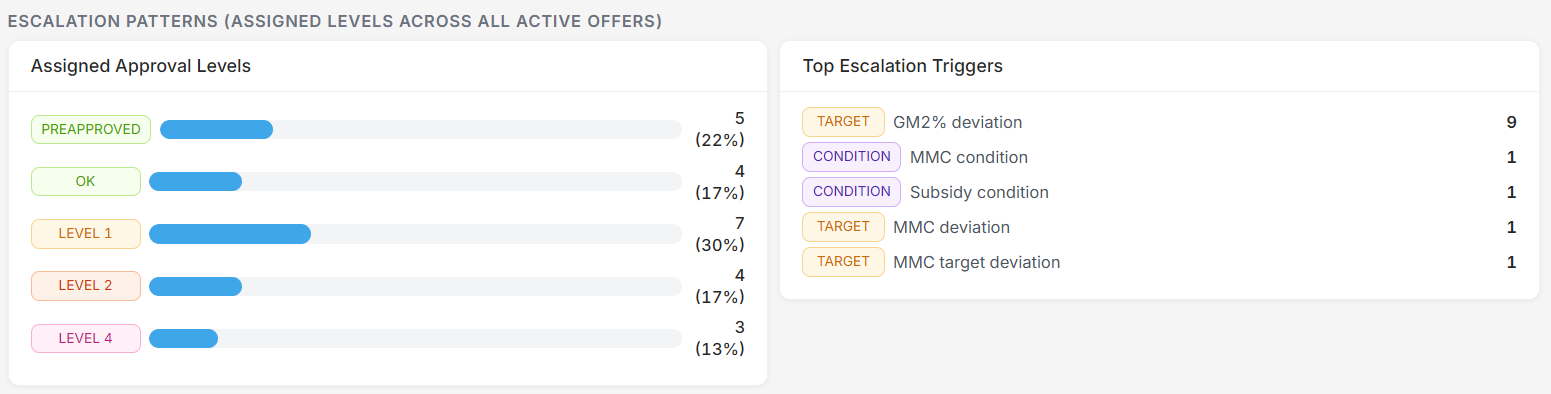
Approvals
Escalation pattern analysis: distribution of offers across approval levels (Preapproved through Level 4), and the top triggers driving escalation: CM2% deviation, MMC conditions, subsidy thresholds, and target deviations.
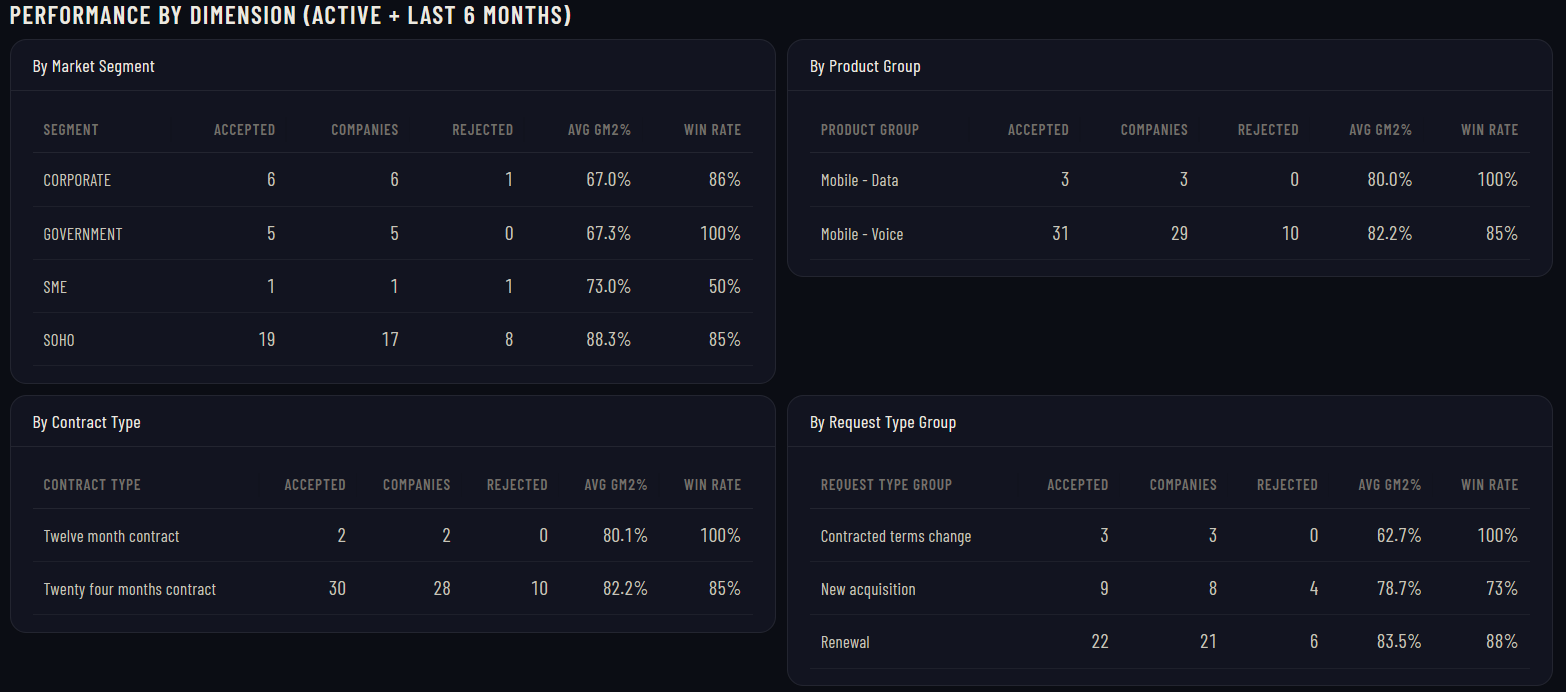
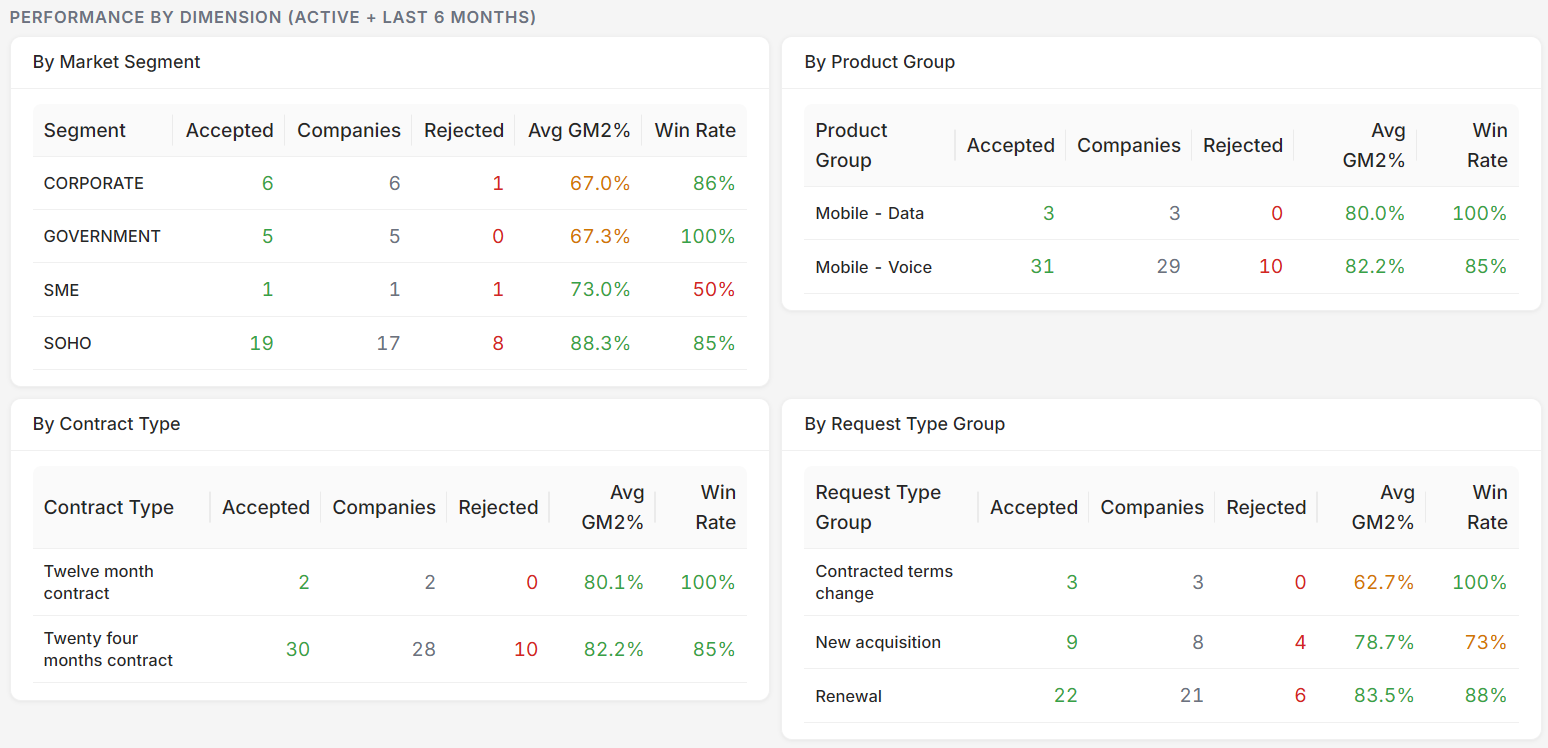
Analytics
Multi-dimensional performance: slice active and historical offers by market segment, product group, contract type, and request type, with accepted counts, average CM2%, and win rates for each dimension.
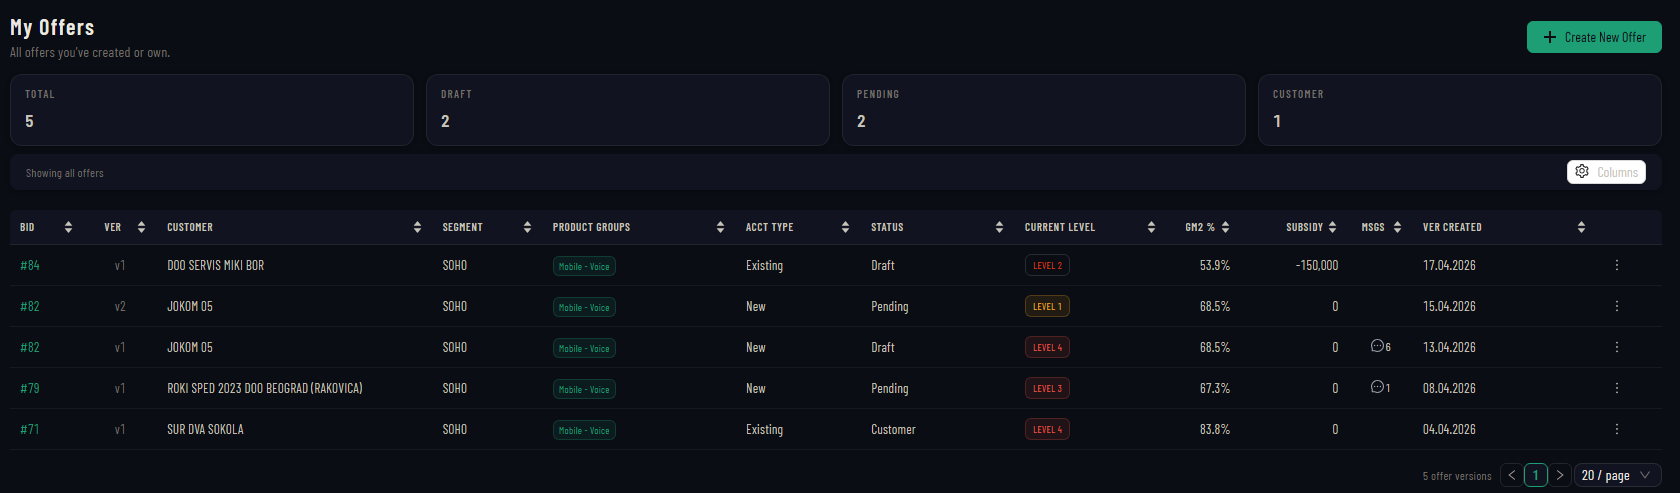
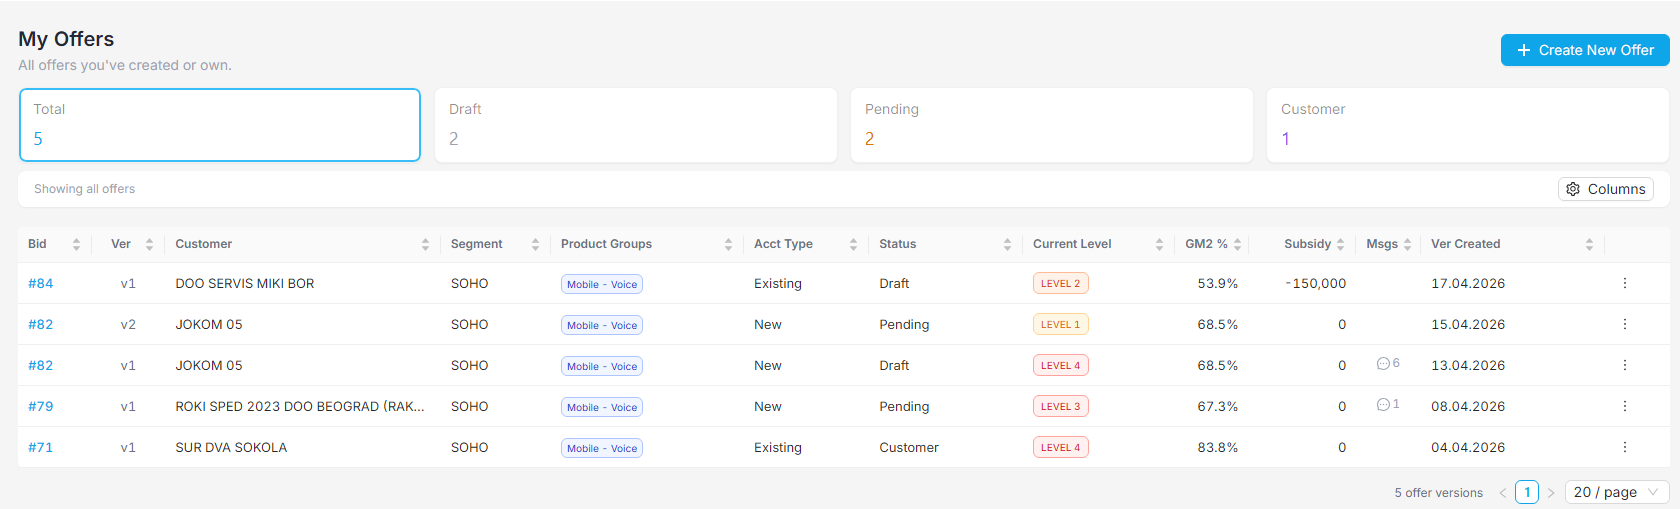
My Offers
Every offer you've created or own, with real-time status, CM2%, approval level, version tracking, and subsidy amounts. Filter by status, sort by any column, and create new offers in one click.
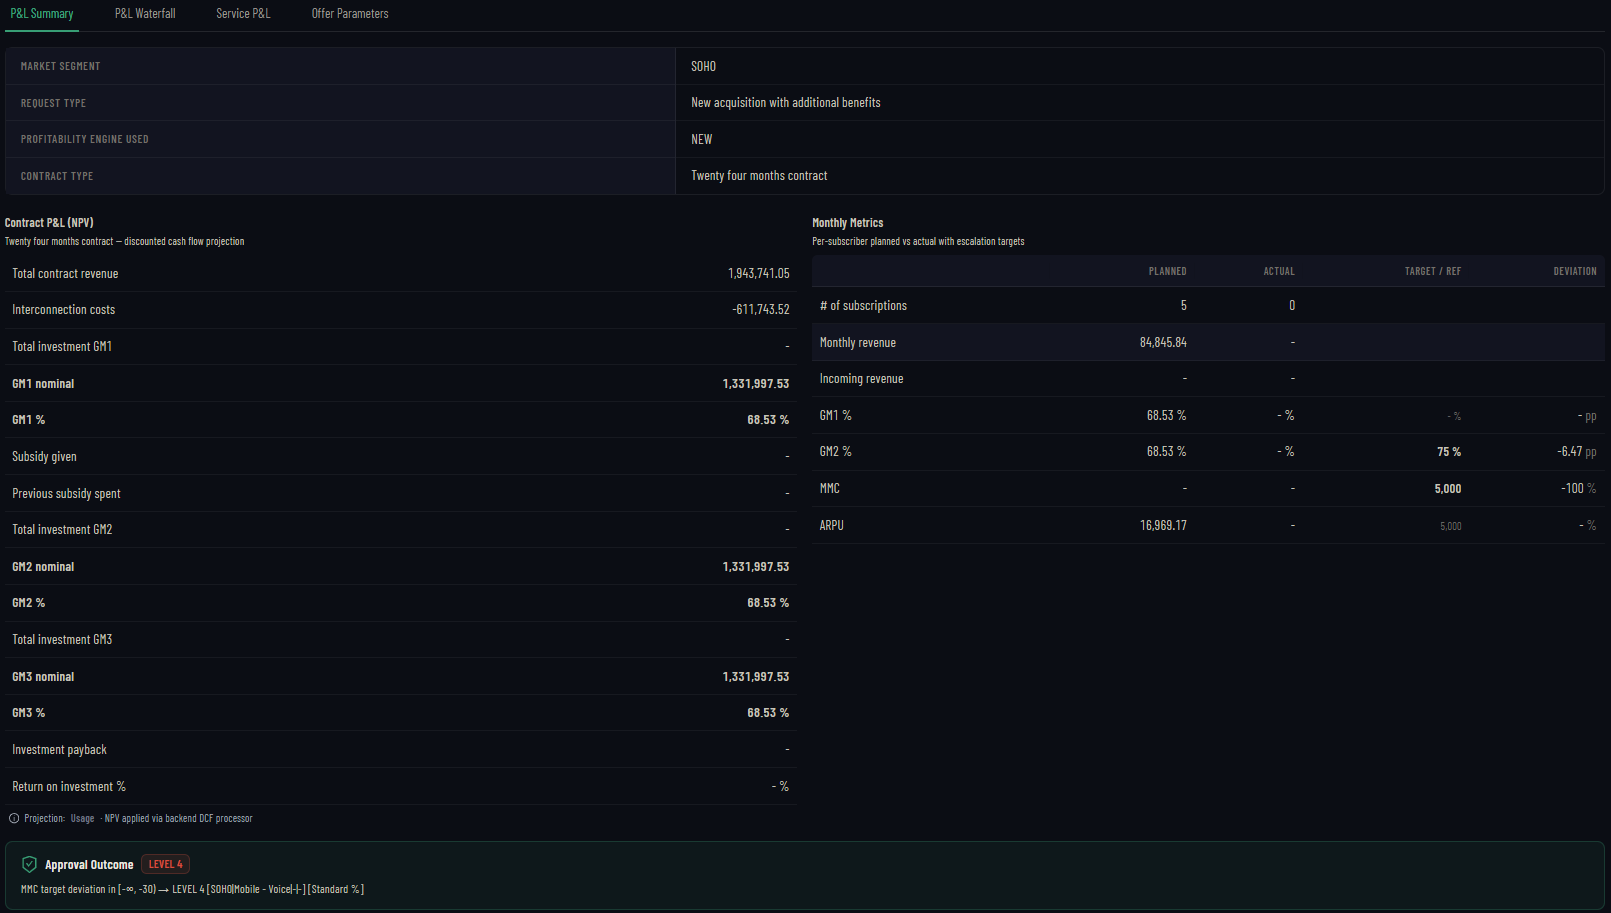
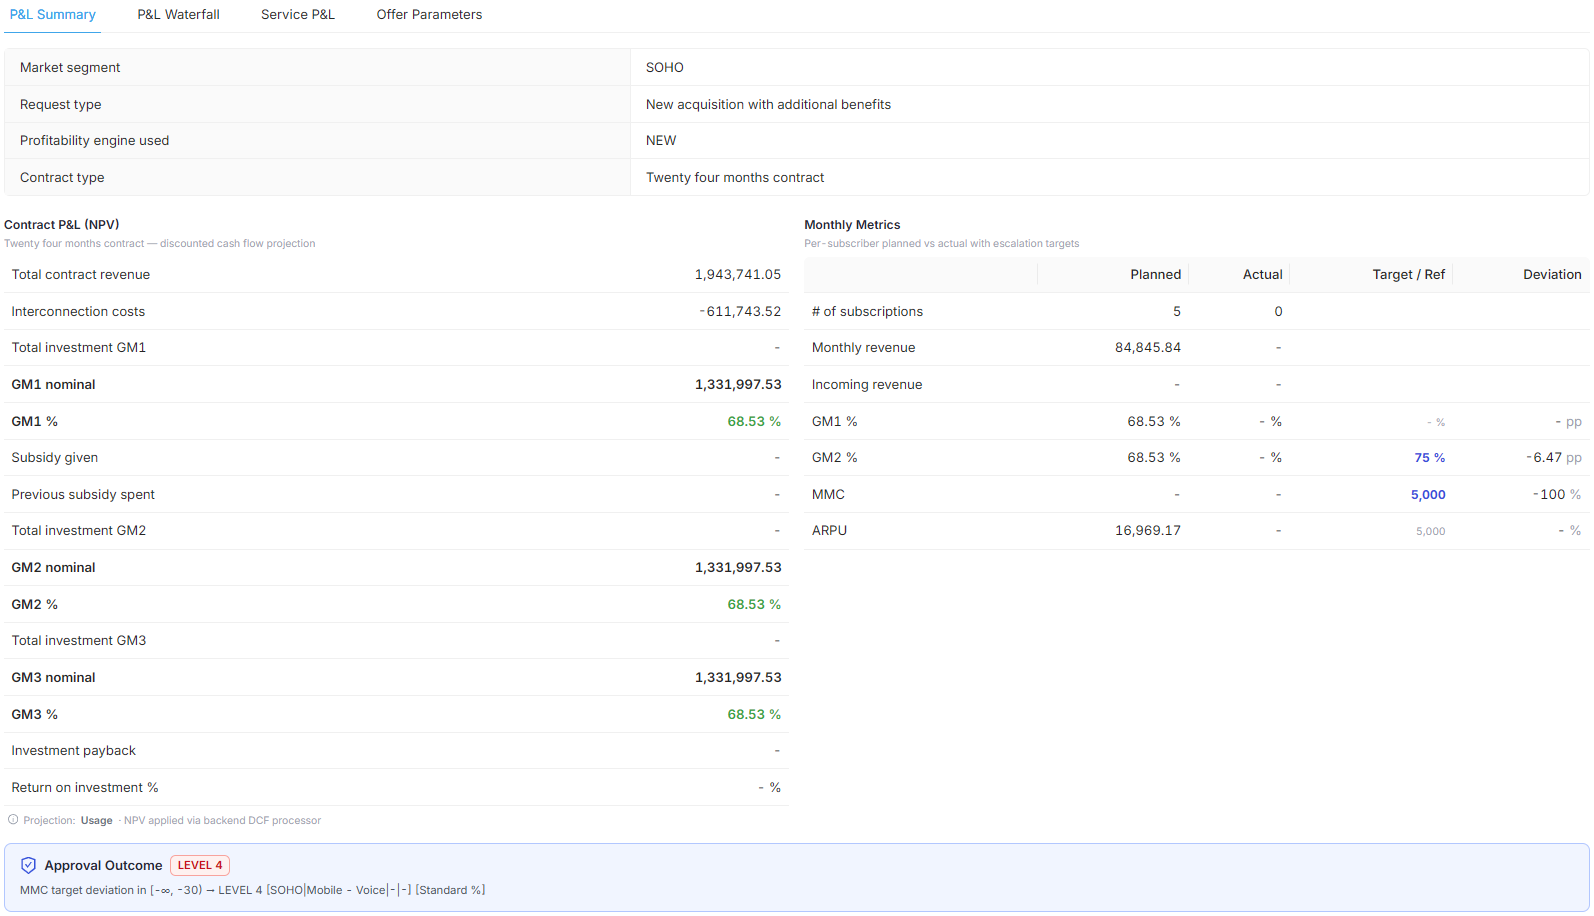
P&L Summary
Complete financial picture: contract revenue, interconnection costs, CM1/CM2/CM3 nominal and percentage margins across all three levels. Monthly metrics compare planned vs. actual with target deviations. Approval outcome with level routing displayed inline.
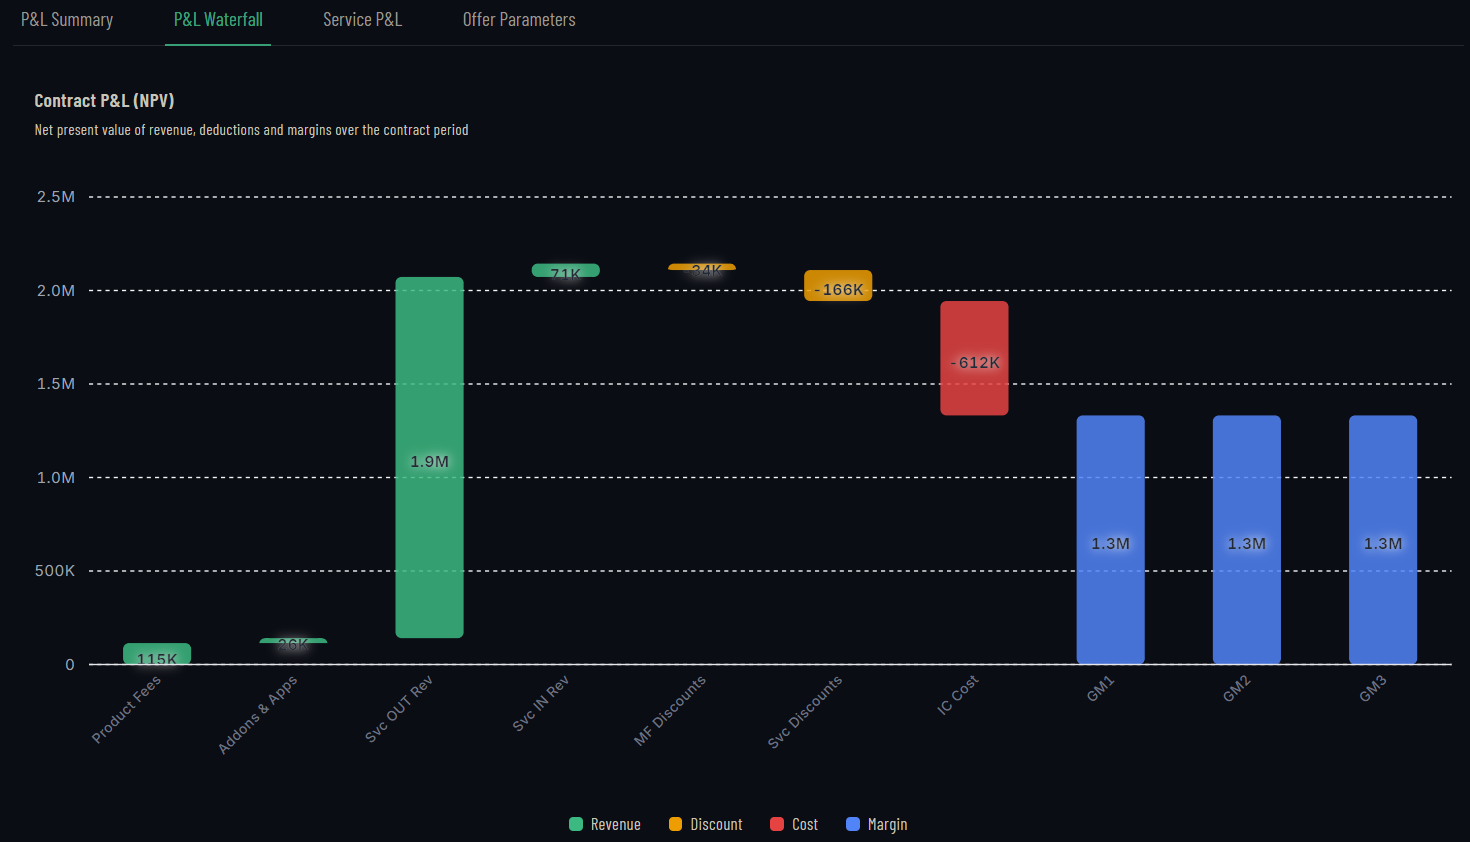
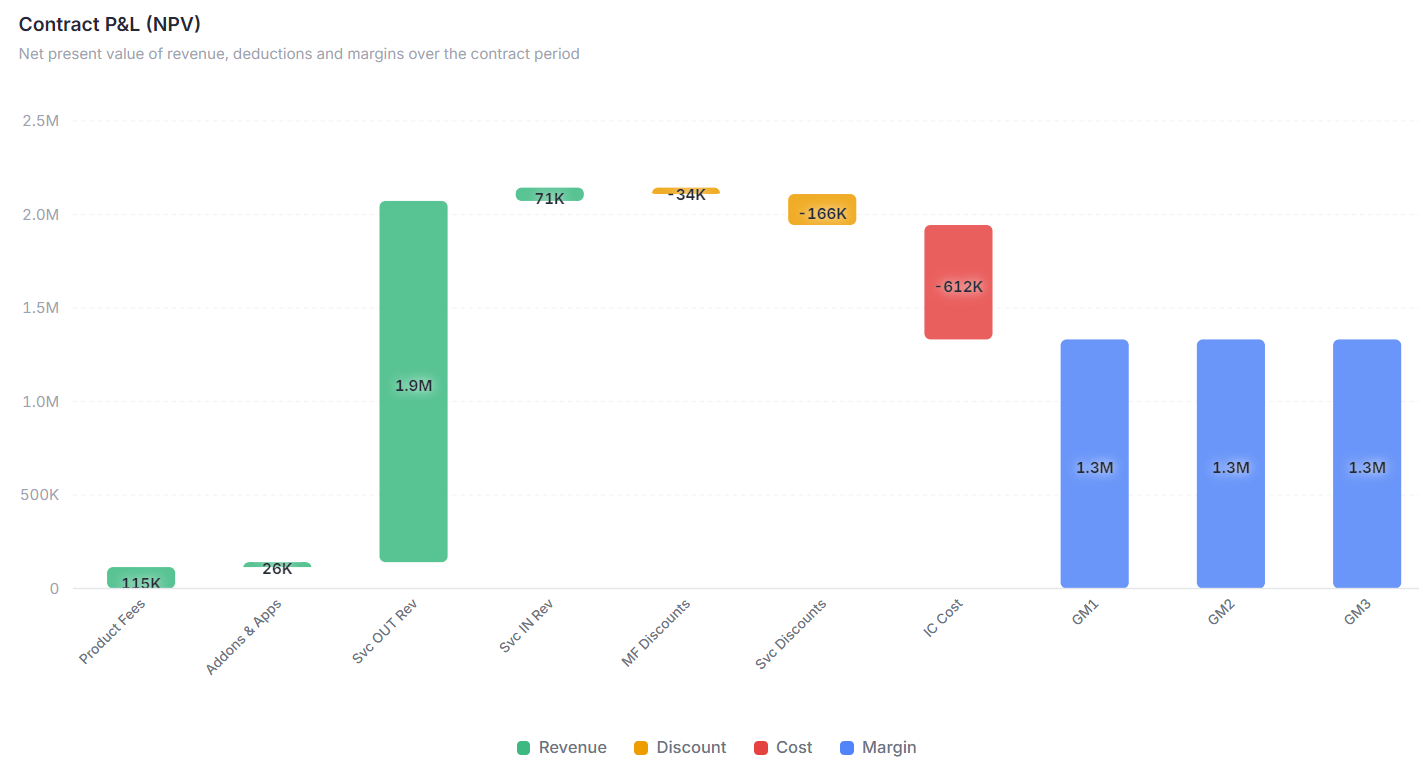
P&L Waterfall
Contract P&L as a waterfall: product fees, add-ons, service revenue (OUT/IN), discounts (MF/Svc), interconnection costs, and resulting CM1, CM2, CM3 margins. Color-coded by revenue, discount, cost, and margin. NPV applied via backend DCF processor.
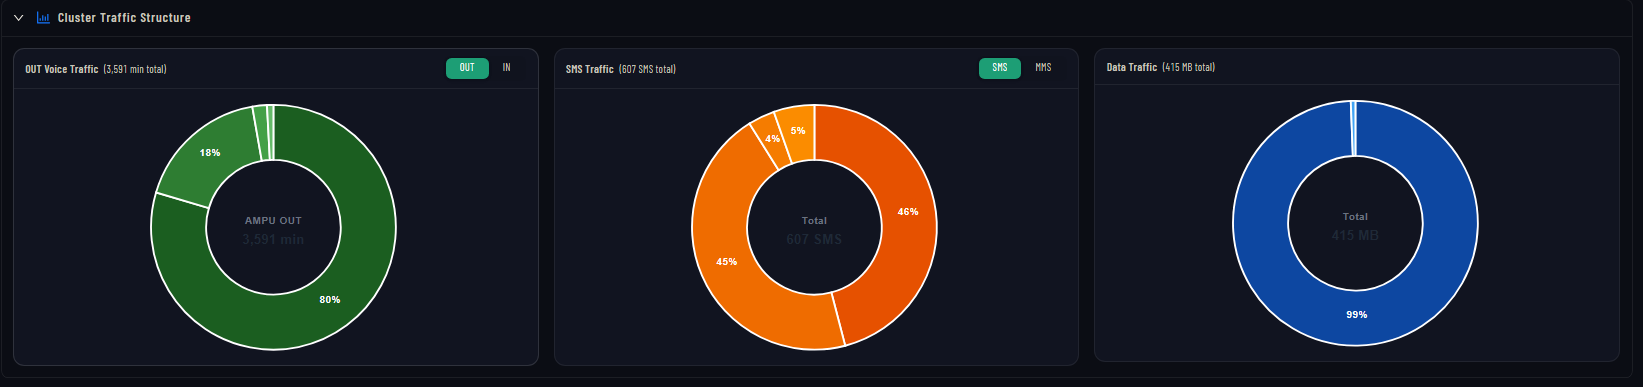
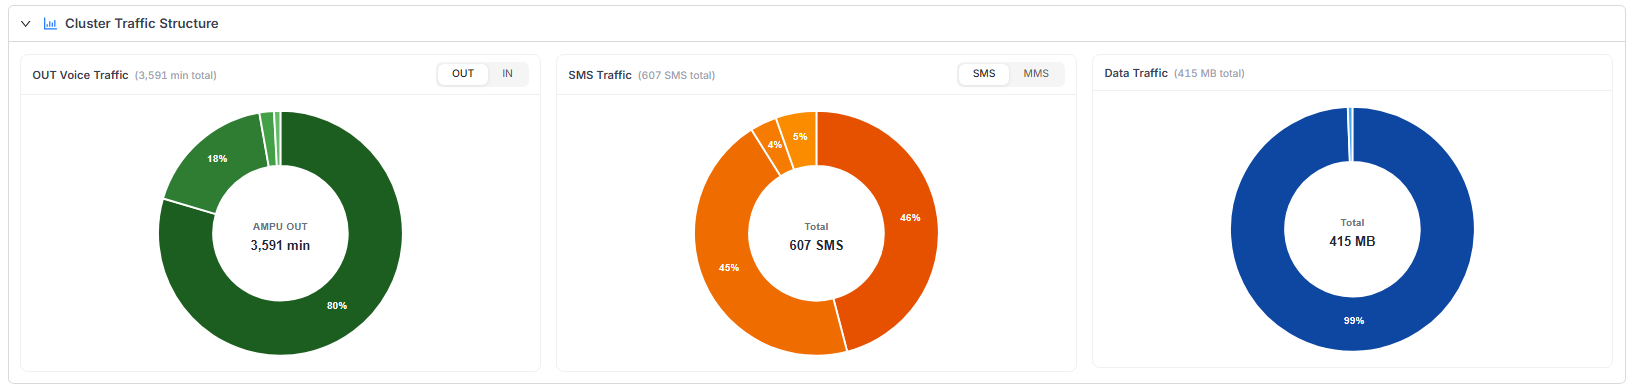
Traffic Intelligence
No manual guesswork. For new subscribers, Vincora's criteria-based profile matching algorithm finds the closest behavioral cluster from your existing base and auto-projects voice (IN/OUT), messaging (SMS/MMS), and data usage. For existing customers, it pulls their actual consumption history. Either way, the profitability engine runs on real data, not assumptions.
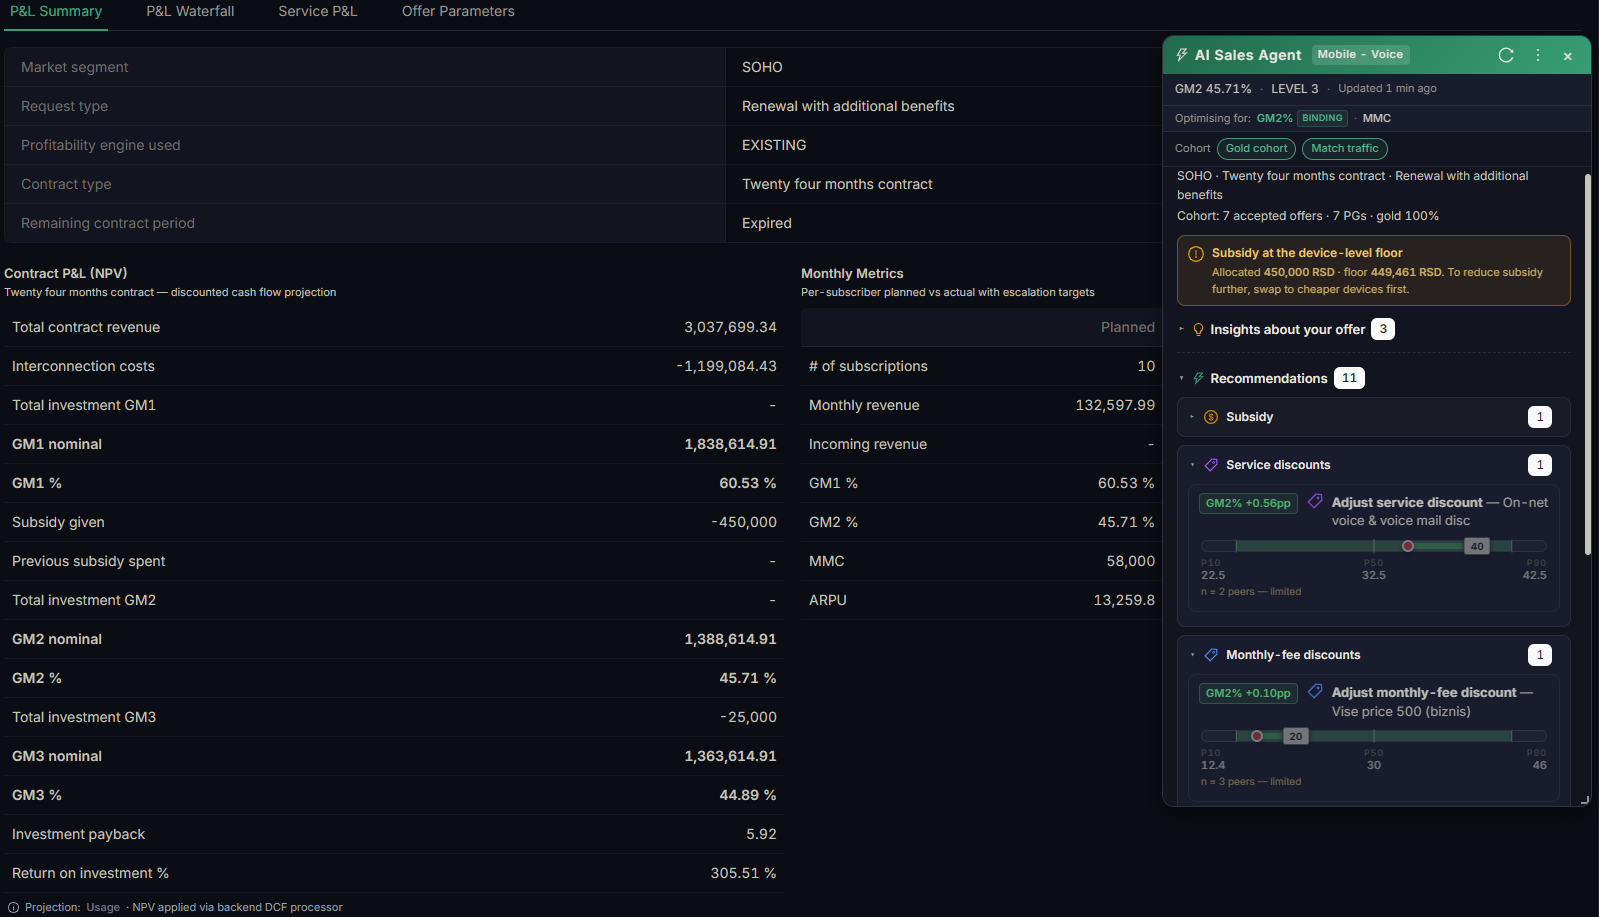
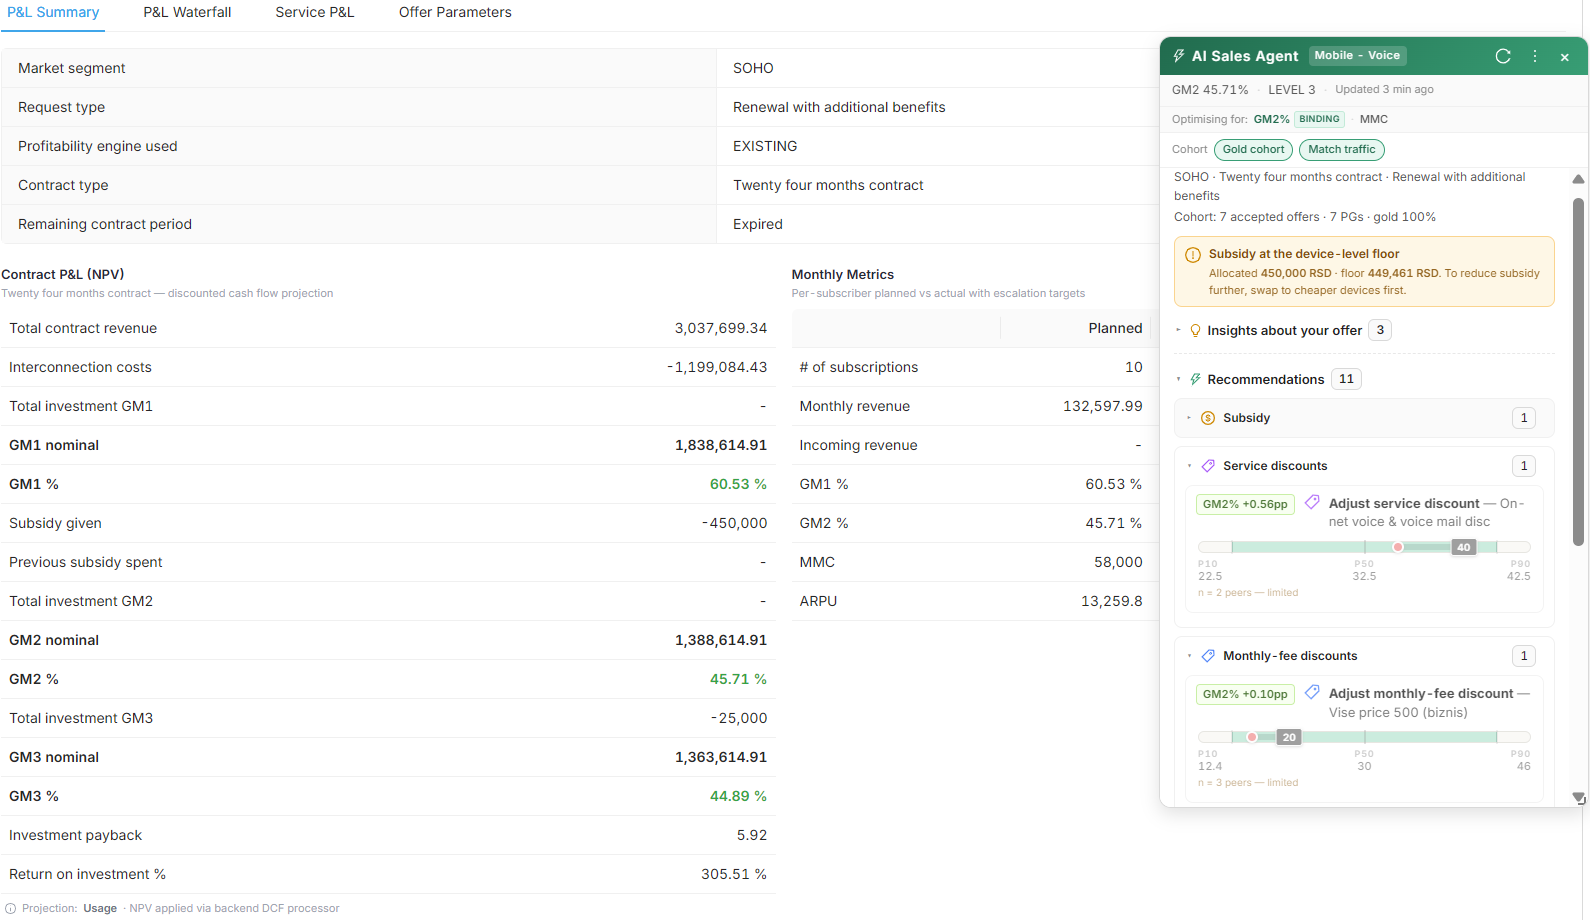
AI Sales Agent
Your reps never guess again. The AI agent matches every prospect to a subscriber cohort, then recommends the exact discount mix (service, monthly fee, add-ons, devices) that maximises acceptance probability while protecting CM2%. Each suggestion shows its margin impact and where it sits within the P10–P90 range of historically accepted deals.